
Figure 1.
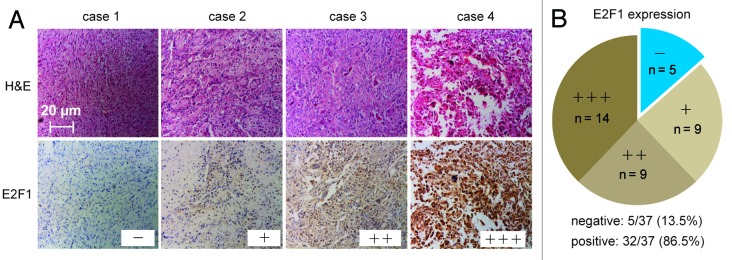
Osteosarcoma cells are coupled with individual differences in the expression levels of E2F1 in vivo. (A) Four reprehensive cases of immunohistochemical analysis of E2F1 expression levels in human osteosarcoma tissues. Four cases were subjected to immunohistochemical staining using an anti-E2F1, and cryosections were stained with H&E. (B) The expression levels of E2F1 in 37 detected osteosarcoma tumor tissues were graded and summarized in pie charts. (A and B) “-”, negative expression; ‘+”, low expression; “++”, medium expression; “+++”, high positive expression.