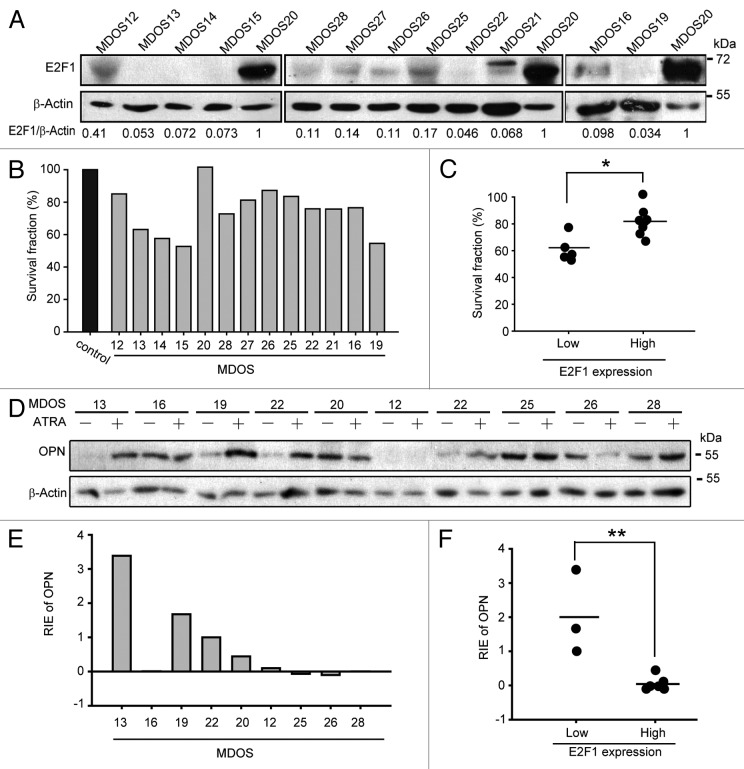
Figure 3.
Inverse correlation between E2F1 expression levels and sensitivity of primary osteosarcoma cells to ATRA-inducd cyto-differentiating. (A) The protein levels of E2F1 in 13 primary osteosarcoma cultures. Expression levels of E2F1 were determined and normalized to β-actin, and then the relative E2F1 expression was set based on the value of sample MDOS20. (B) The anti-proliferation effect of ATRA in 13 primary osteosarcoma cultures. Primary osteosarcoma cultures were treated with 5 μM ATRA for 7 d followed by trypan blue exclusion. (C) The relationship between E2F1 expression levels and anti-proliferation effects of ATRA in 13 primary osteosarcoma cultures. According to the relative E2F1 expression value of MDOS16, cultures were divided into 2 groups: E2F1 expression low (MDOS13, 14, 15, 19, 21, 22) and high (MDOS12, 16, 20, 25, 26, 27, 28). Then cell viabilities were analyzed. *, P < 0.05. (D and E) The protein levels of OPN in the absence or presence of ATRA treatment in primary osteosarcoma cultures. Primary osteosarcoma cultures were treated with 5 μM ATRA for 7 d, and the levels of OPN were determined and normalized to β-actin; then the relative increased OPN expression was set based on the value of sample MDOS16. RIE, relative increased expression. (F) The correlation between relative increased OPN expression and basal E2F1 expression levels in primary osteosarcoma cultures. As presented in (C), 2 groups were set first, then the relative increased OPN expression for each culture were analyzed as presented. **, P < 0.01.

