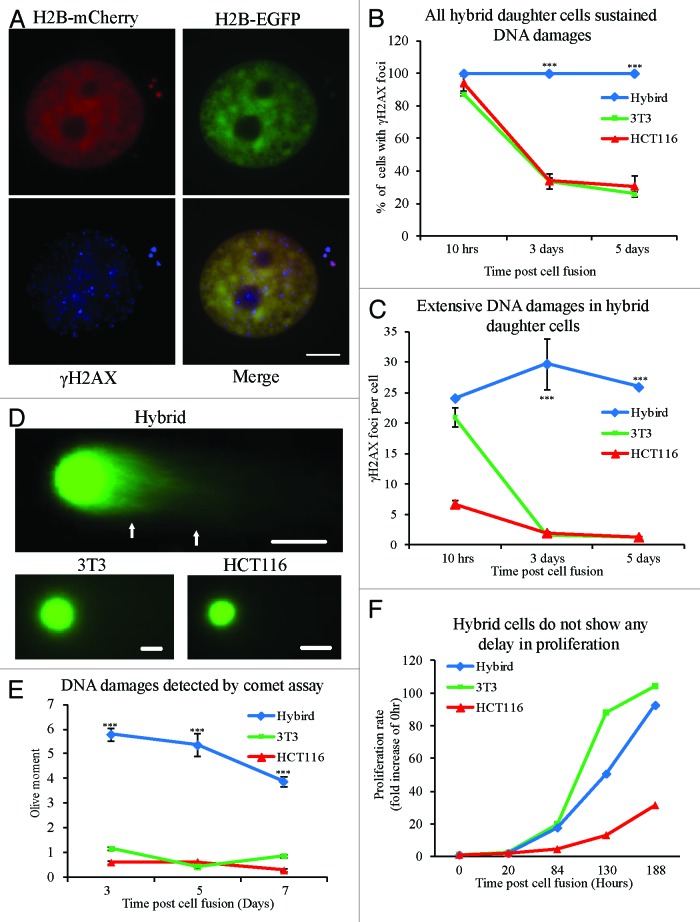
Figure 5. Hybrid daughter cells sustain DNA damages and continually proliferate during clone formation. (A) Representative images of γH2AX staining in hybrid daughter cells. (B) Percentage of cells with γH2AX positive staining. (C) The average number of γH2AX foci per cell in 3 types of cells at each time point (10 h, 3 d, and 5 d) after PEG-induced cell fusion during clone formation. Statistical results in (B and C) from more than 60 cells at each time point in 3 different types of cells. At 1 d after PEG-induced cell fusion, mixed cells were sorted twice by flow cytometry to enrich hybrid cells or control cells respectively, then detection of DNA damage in 3 types of cells was performed by comet assay at different time points (3, 5, and 7 d) during clone formation. (D) Representative images and (E) statistical results from more than 100 cells at each time point in 3 different types of cells. (F) The proliferation rate of 3 types of cells during clone formation. The number of single-cell clones in 3 types of cells (n = 3 in HCT116, 7 in hybrid cells and 9 in 3T3). Bars = 20 μm. Asterisks denote statistically significant difference between hybrid cells and control cells. ***P < 0.001, 2-tailed t test (C and E), chi-square test (B). Mean ± SD, from 2 independent experiments.

An official website of the United States government
Here's how you know
Official websites use .gov
A
.gov website belongs to an official
government organization in the United States.
Secure .gov websites use HTTPS
A lock (
) or https:// means you've safely
connected to the .gov website. Share sensitive
information only on official, secure websites.
