
Figure 2. PABCs arising in mice are aggressive and have increased stromal involvement.
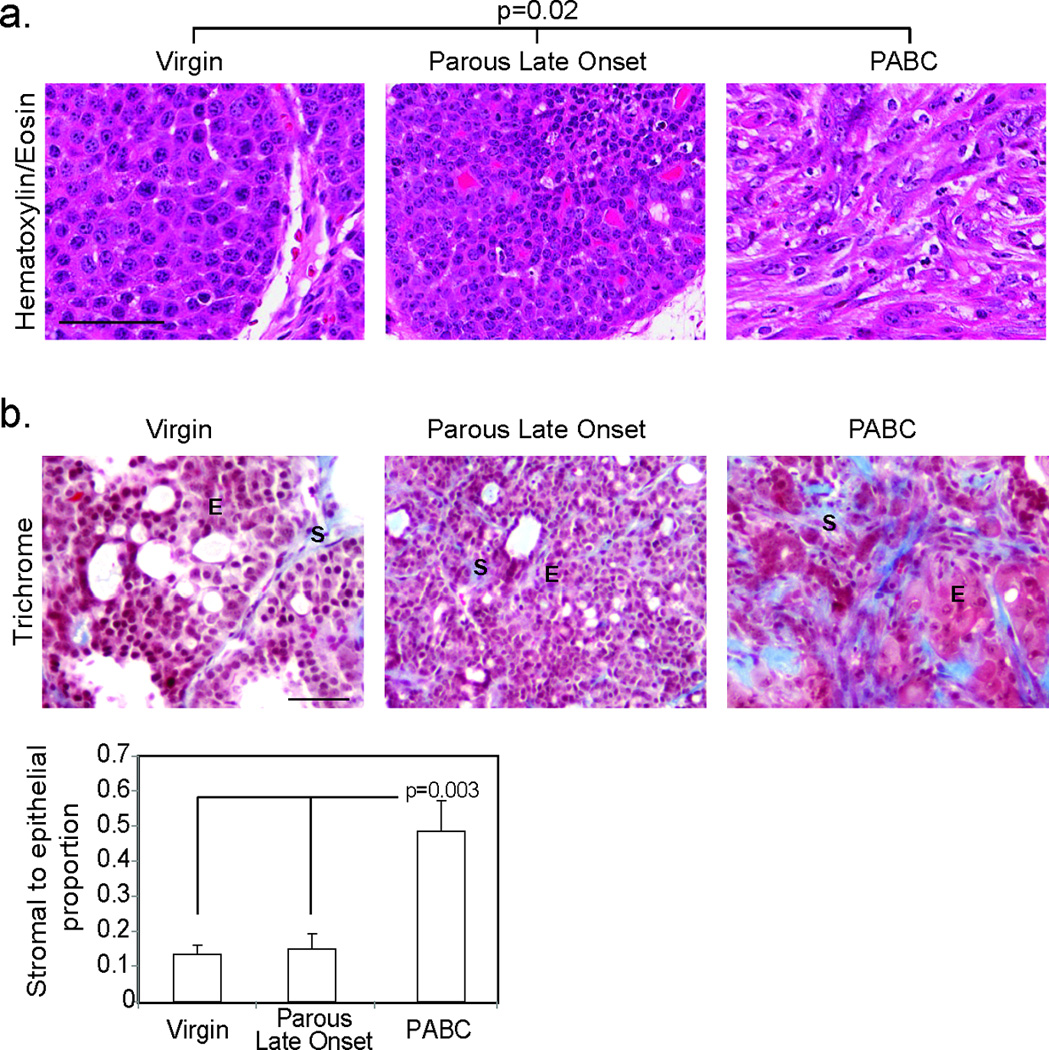
Representative photomicrographs depict Hematoxylin and Eosin staining (a; n=10 virgin, 6 parous late onset and 8 PABCs) of tumor morphology allowing characterization of tumors as solid or disorganized, and trichrome detection of collagen deposition with accompanying quantification of stromal involvement (b; n=4). Scale bars = 50 µm. For bar graph, columns represent the mean and error bars represent the SEM. ANOVA determined p-value. E, epithelia; S, stroma.