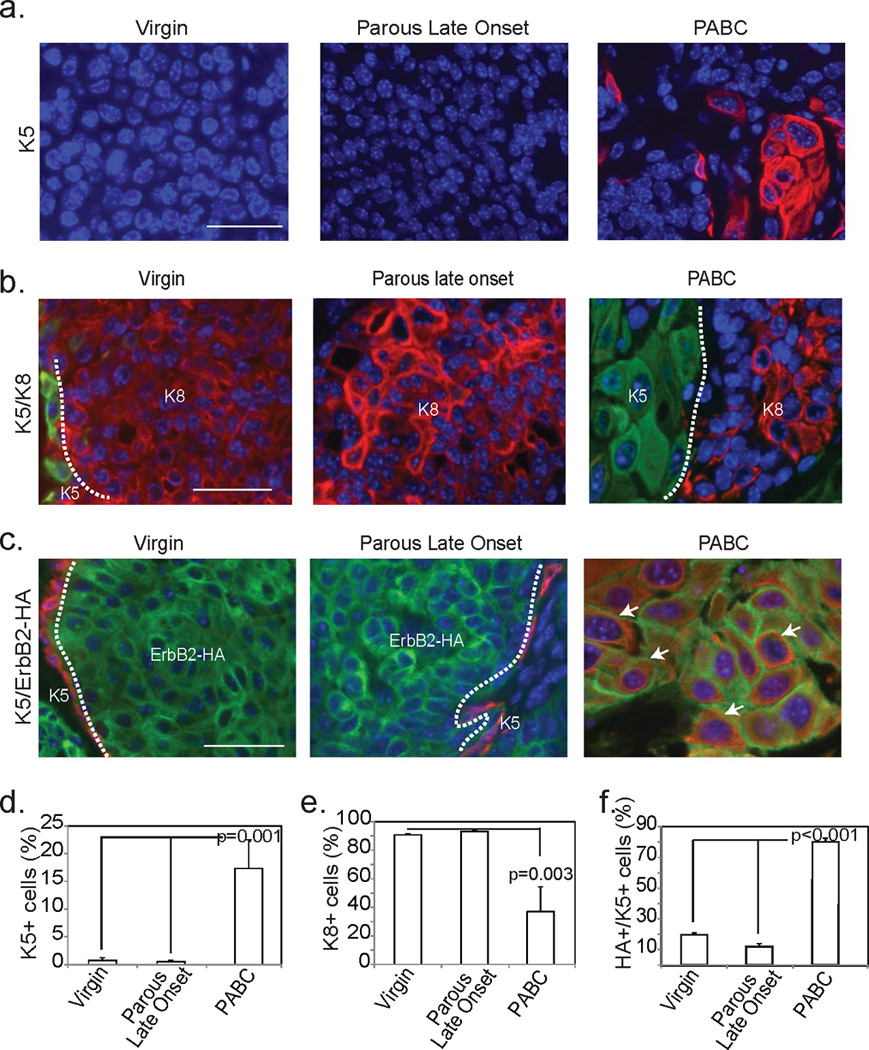
Figure 3. PABCs encompass oncogene expressing cells of both luminal and basal lineage.

Representative photomicrographs depict immunofluorescent detection of K5 (a), K8 (b) and colocalization of K5 and the HA tag of the RCAS-caErbB2 construct (c) along with accompanying quantification of the number of basal cells (d; n=6), the number of luminal cells (e; n=3) and the number of basal cells expressing the oncogene (f; n=4). Scale bars = 20 µm. ANOVA determined all p-values. Columns represent the mean and error bars represent the SEM. White dotted lines demarcate regions of differential immunofluorescence and arrows indicate cells expressing both K5 and ErbB2.
