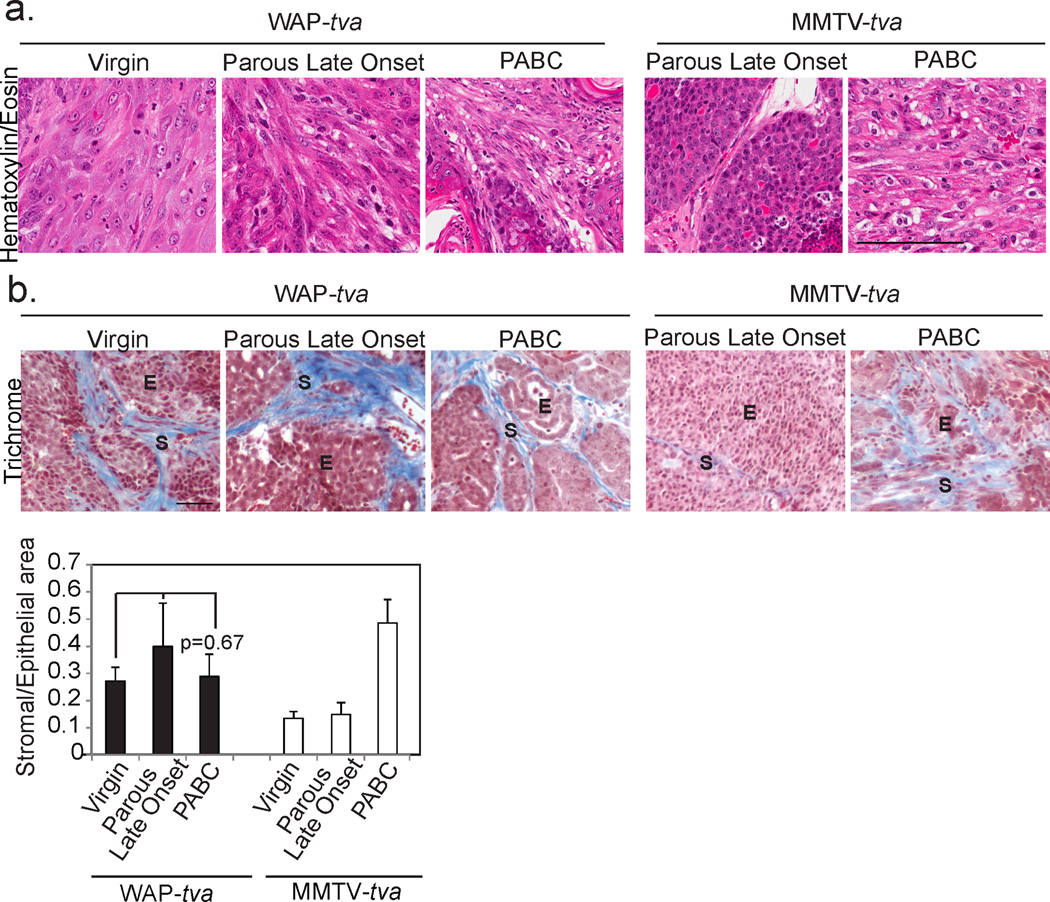
Figure 7. Oncogenic signaling targeted to alveolar cells results in PABC-like tumor histopathology irrespective of parity status or time since pregnancy.

Representative photomicrographs depict Hematoxylin and Eosin staining (a; n=9 virgin, 5 parous late onset and 7 PABCs) of tumor morphology allowing characterization of tumors as solid or disorganized and trichrome detection of collagen deposition (b; n=4) with accompanying quantification of stromal area. ANOVA measured p-value. Dotted black lines demarcate epithelial and stromal regions in (b). E, epithelium and S, stroma. Columns represent mean and error bars represent SEM for all bar graphs. Black columns represent tumors from WAP-tva mice and white columns from MMTV-tva mice.
