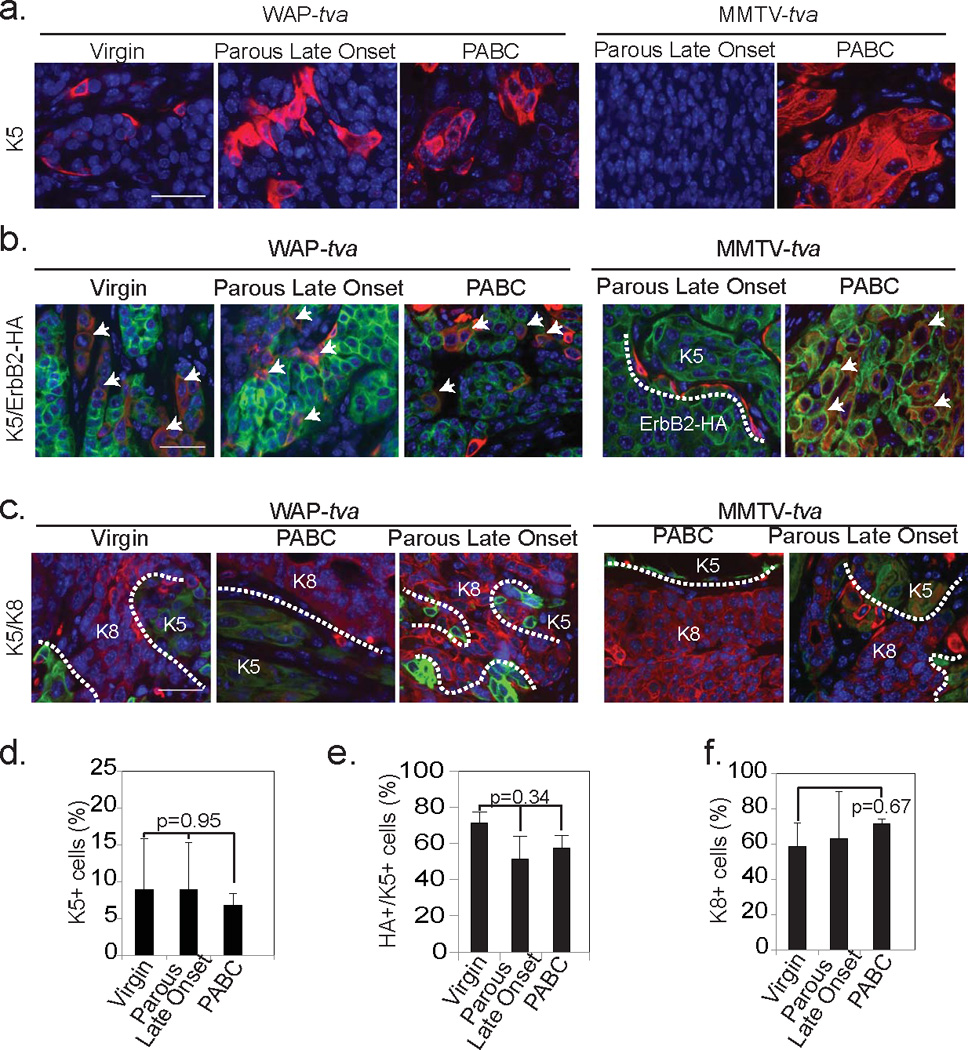
Figure 8. Tumors originating from alveolar cells have increased cellular heterogeneity irrespective of parity status.

Representative photomicrographs indicating K5 positivity (a; n=5), co-localization of K5 (red) with oncogenic construct (green) (b; n=4) and lack of colocalization between basal (K5; green) and luminal (K8; red) cell markers (c; n=3) in all three tumor groups with accompanying quantifications (d–f). Arrows indicate colocalization (b). White dotted lines demarcate HA+ and K5+ regions (b) and K8+ and K5+ regions (c). Scale bars = 20µm. Bars represent mean and error bars the SEM. ANOVA determined all p-values.
