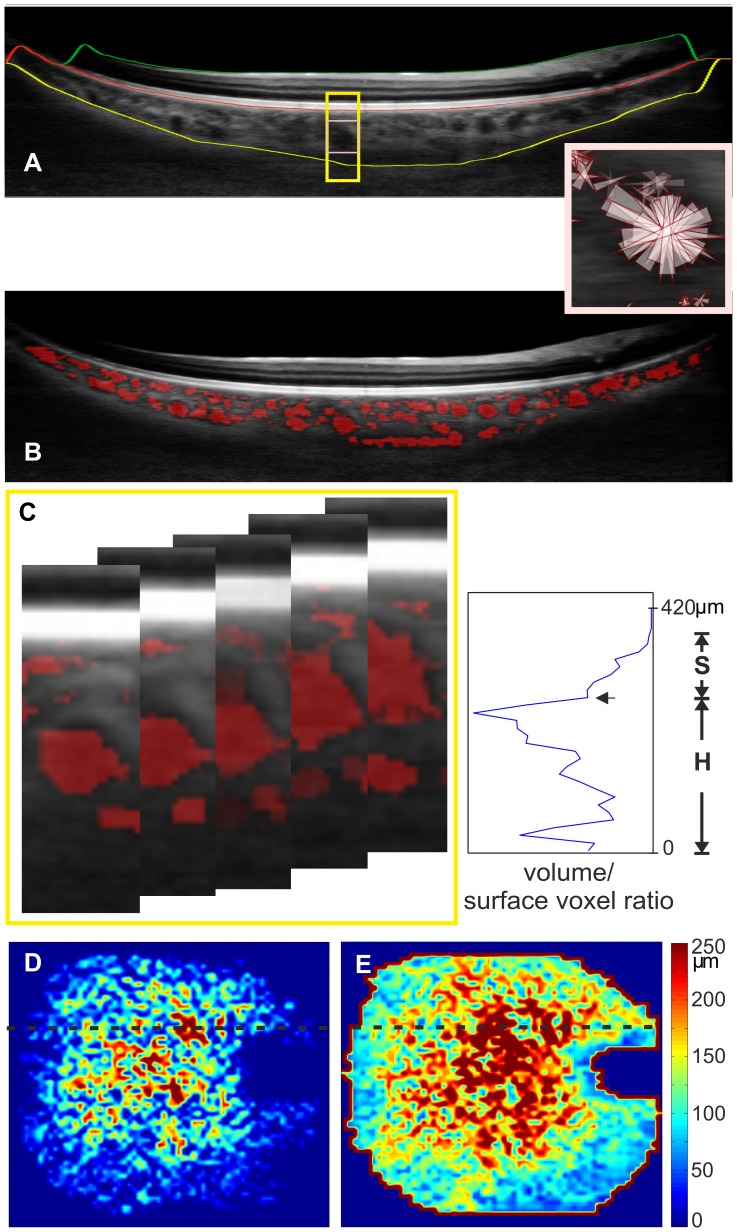
Figure 1. Automatic segmentation of Haller's and Sattler's layer for thickness mapping.
OCT B-scan (A) visualizes the segmentation lines for the retina between the ILM (green line) and the RBC complex and the identified vessel voxels are visualized in red (B). The choroid is located between the RBC complex and the sclera (yellow line). Probability cones (small rectangle enlarged) were drawn to demonstrate expected vessel core position. The cone projections are in 3D, butthe concept is presented in two dimensions. The ratio of volume voxels to surface voxels that were generated was plotted for a 1×1 degree volume. This volume consists of 14 B-scans and is represented by the 5 B-scans in the yellow rectangle (C). The plot is used for determining the border between the two sublayers by detecting the largest ratio as Haller's layer vessels (H),and the local minimum is the border (arrow) to Sattler's layer (S). Plots were used to generate thickness maps for Sattler's (D) and Haller's layers (E) across the scan area.

