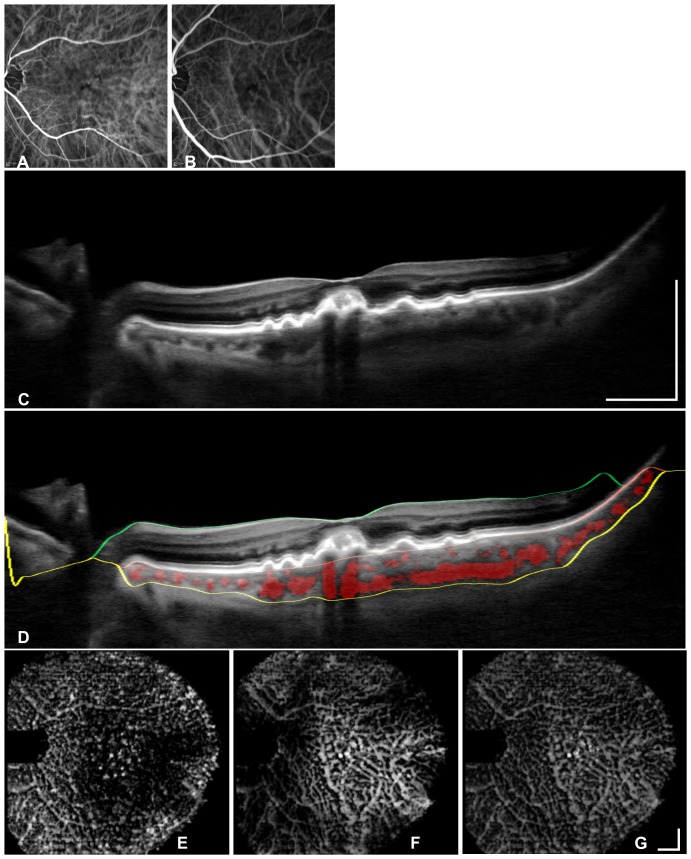
Figure 3. Segmentation validation in a non-neovascular AMD eye via a comparison of the segmented vasculature with indocyanine green angiography (ICGA).
Early phase (A) and middle phase (B) angiography images show the ICGAresolution for choroidal vascular imaging. OCT B-scan centered on the fovea (C), and segmented areasare marked in red (D) to visualize vessel segmentation. The OCT B-scan (D) shows the segmentation lines for the retina between the ILM (green line) and the RBC complex. The choroid is located between the RBC complex and the sclera (yellow line). En face views are locatedat the inner choroid (E), the outer choroid (F) and the entire choroid (G) to demonstrate captured vessels and depth information. The bars represent 1 mm.

