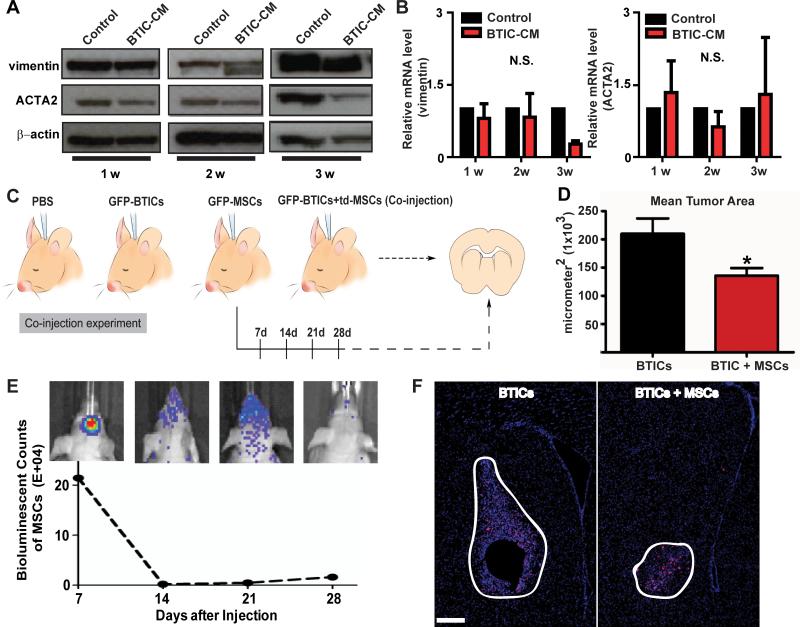
Figure 5. hAMSCs are not tumorigenic and do not transform into tumor associated fibroblasts (TAFs) in vitro or in vivo.
(A-B) hAMSCs were cultured in BTIC-CM or control media for 1-3 weeks and (A) Western blots (β-actin served as a control) and (B) Real-time RTPCR (GAPDH served as a control) were performed to quantify TAF markers (vimentin and ACTA2). (C) Schematic of the co-injection experiment where PBS, GFP-BTICs, GFP/bioluminescent-hAMSCs (GFP-hAMSCs), or GFP-BTICs mixed with td-tomato-hAMSCs (td-hAMSCs) were injected into mice and sacrificed and sacrificed 4 weeks later. (D) Quantification of mean tumor area of the GFP-BTIC and co-injection groups using DAPI staining. The co-injection group had a smaller mean tumor area of 135,700 μm2 as compared to GFP-BTIC group, with a mean tumor area of 209,800 μm2 (p=0.0189). (E) Live animal imaging of the GFP-hAMSCs condition. At 14 days post GFP-hAMSCs injection, the hAMSC signal drastically decreases. Each mouse brain represents the counts of bioluminescent signal at each time point. (F) DAPI and human nuclei stain for GFP-BTICs and co-injection groups (n=5). Larger tumors were only seen in the GFP-BTICs condition compared the co-injection condition. Brain sections and tumor mass are outlined. Scale bar, 200 μm. N.S., not significant.

