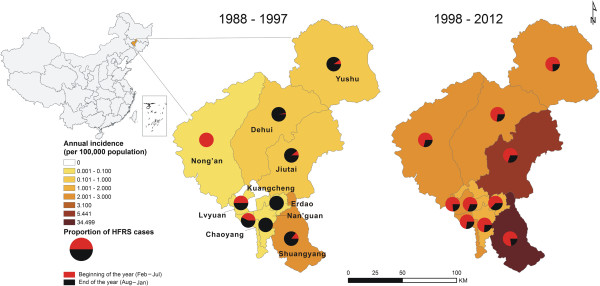
Figure 1.

Thematic map of annual incidence for each county before and since 1998, Changchun. The gradient colors represent HFRS incidence for each county, and the pie-charts with red and black colors indicate the proportions of HFRS cases for two 6-month study periods (beginning of the year (February–July) and end of the year (August–January)).
