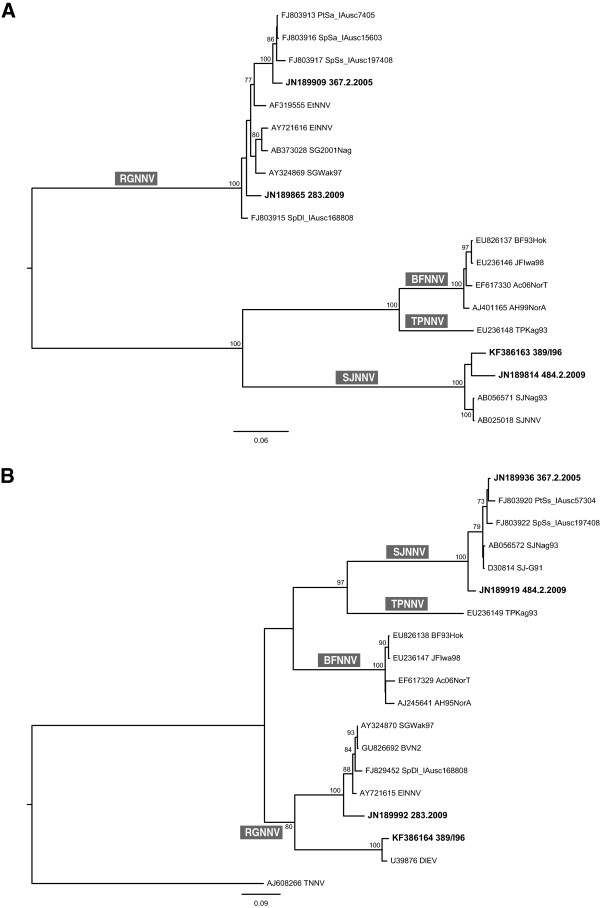
Figure 1.

ML phylogenetic trees. (A) RNA1 complete ORF. (B) RNA2 complete ORF. Fish nodaviruses characterized in the present study are labelled in bold. The numbers at branch points correspond to bootstrap values expressed as percentages. The genotype subdivision according to Nishizawa et al. [9] is shown at the main branches. Scale bars represent nucleotide substitutions per site.
