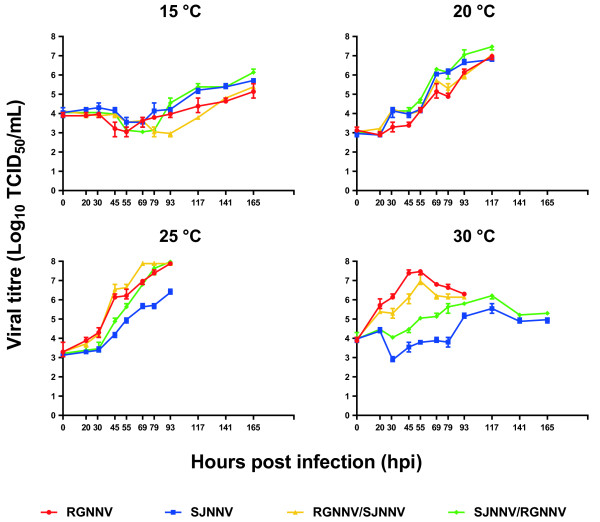
Figure 2.

Betanodavirus replication kinetics. Growth curves developed for the RGNNV, SJNNV, RGNNV/SJNNV and SJNNV/RGNNV strains at different incubations temperatures (15, 20, 25, 30 °C). Numbers in the y-axis represent the Log10 of viral titres expressed as TCID50/mL; in the x-axis, the observation points expressed as hours post infection (hpi) are reported. Data are plotted as mean and range of triplicate samples.
