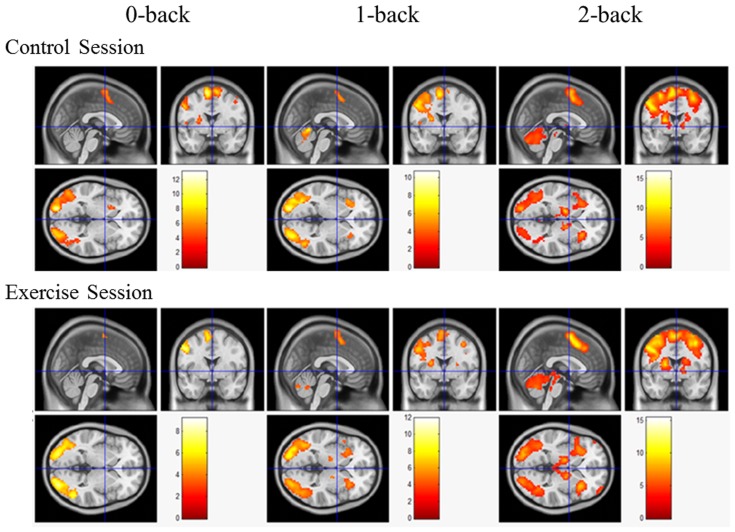
Figure 2. Brain activation maps during the performance of the N-back task in the exercise session and the control session at the level of p<0.001 (uncorrected), Z>2.3, and a cluster size >5 voxels for comparisons using cluster detection.
Red areas indicate greater activation during the N-back condition relative to the resting condition.

