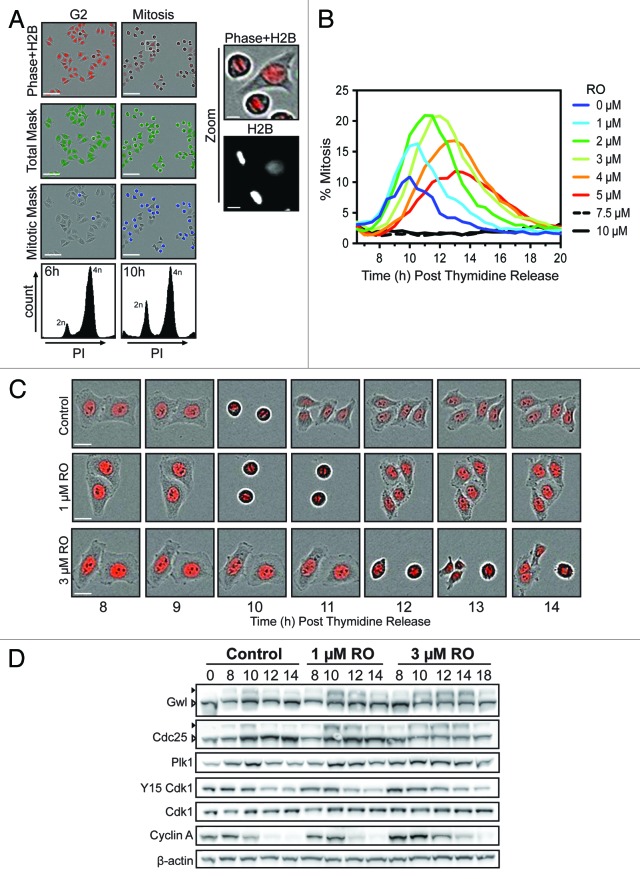
Figure 1. Effects of partial pre-mitotic Cdk1 inhibition. (A) Synchronized HeLa-H2B-mCherry cells were released from G1/S and treated at 6 h post-release (early G2 phase) with increasing doses of the Cdk1 inhibitor RO3306 (RO). Shown are characteristic fields of G2 and mitotic images captured, along with specific masks generated using the IncuCyte to count total cell number (green) and accurately identify mitotic cells (blue) based on differential H2B-mCherry intensity and shape. Scale bar = 200 µM (10 µM for zoom). (B) Data from (A) presented as a graph showing the percentage of mitotic cells at each time point. Images were taken every hour up to 20 h post-release from thymidine. Graph is representative of 3 independent experiments. (C) Time-lapse images of representative cells from (B), showing the timing of cell division. Scale bar = 20 µM. (D) HeLa cells were synchronized with thymidine, released and treated with RO at 6 h post-release. Samples were then harvested at the indicated times post-release, lysed, and analyzed by western blot with the indicated antibodies. Triangles indicate phosphorylated (black) and non-phosphorylated (white) forms of Greatwall (Gwl) and Cdc25C. All data shown are representative images from 3 independent experiments.

An official website of the United States government
Here's how you know
Official websites use .gov
A
.gov website belongs to an official
government organization in the United States.
Secure .gov websites use HTTPS
A lock (
) or https:// means you've safely
connected to the .gov website. Share sensitive
information only on official, secure websites.
