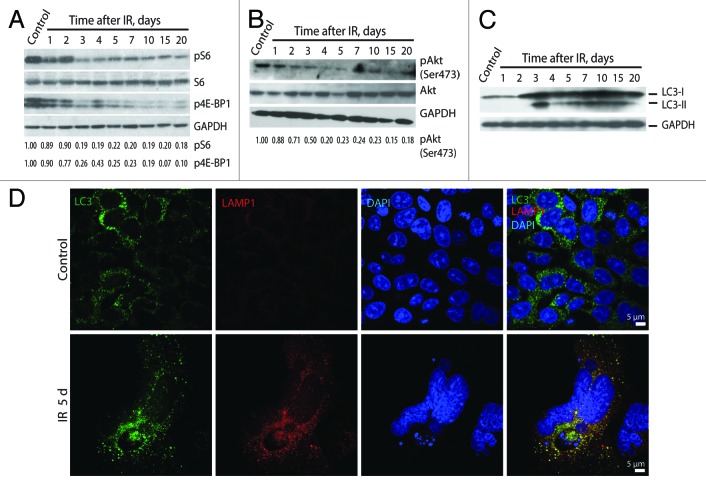
Figure 11. Irradiated E1A + E1B cells show suppression of mTORC1 and mTORC2 and activation of autophagy. Western blot analysis of phosphorylation of S6 ribosomal protein and 4E-BP1 (A) and phosphorylation of Akt on Ser473 (B). The indicated numbers show the results of western blot densitometry. (C) Western blot analysis of LC3-I conversion to LC3-II. (D) Analysis of LC3 and LAMP1 colocalization in non-irradiated and IR-treated cells. Confocal images are shown.

An official website of the United States government
Here's how you know
Official websites use .gov
A
.gov website belongs to an official
government organization in the United States.
Secure .gov websites use HTTPS
A lock (
) or https:// means you've safely
connected to the .gov website. Share sensitive
information only on official, secure websites.
