
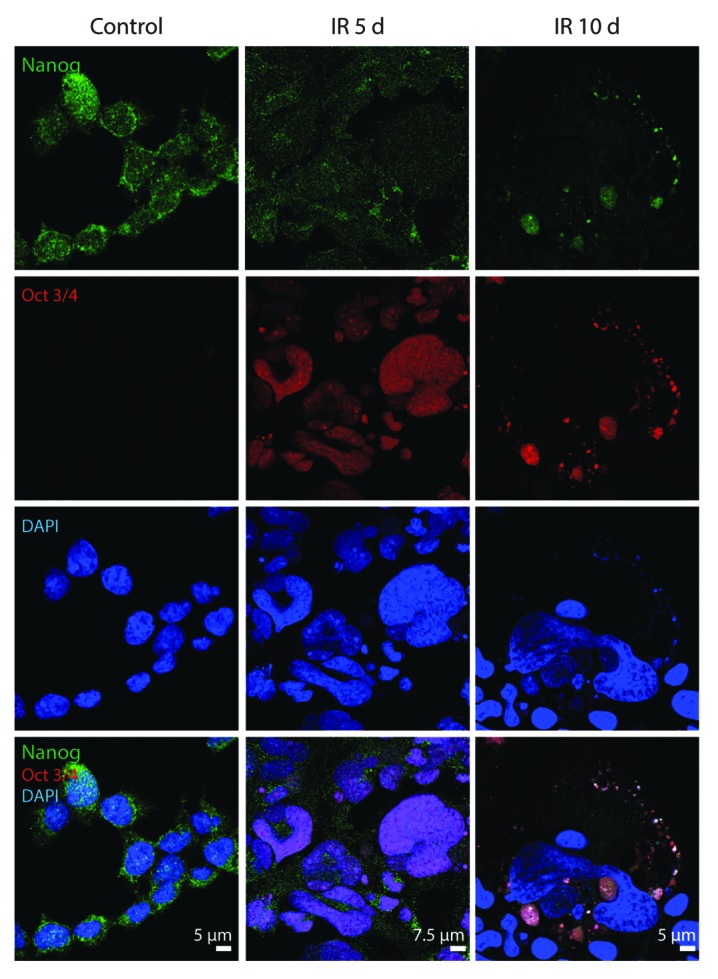
Figure 12. Expression of Nanog and Oct3/4 in E1A + E1B cells. Confocal images of immunofluorescent stained cells are shown.
Official websites use .gov
A
.gov website belongs to an official
government organization in the United States.
Secure .gov websites use HTTPS
A lock (
) or https:// means you've safely
connected to the .gov website. Share sensitive
information only on official, secure websites.
Figure 12. Expression of Nanog and Oct3/4 in E1A + E1B cells. Confocal images of immunofluorescent stained cells are shown.