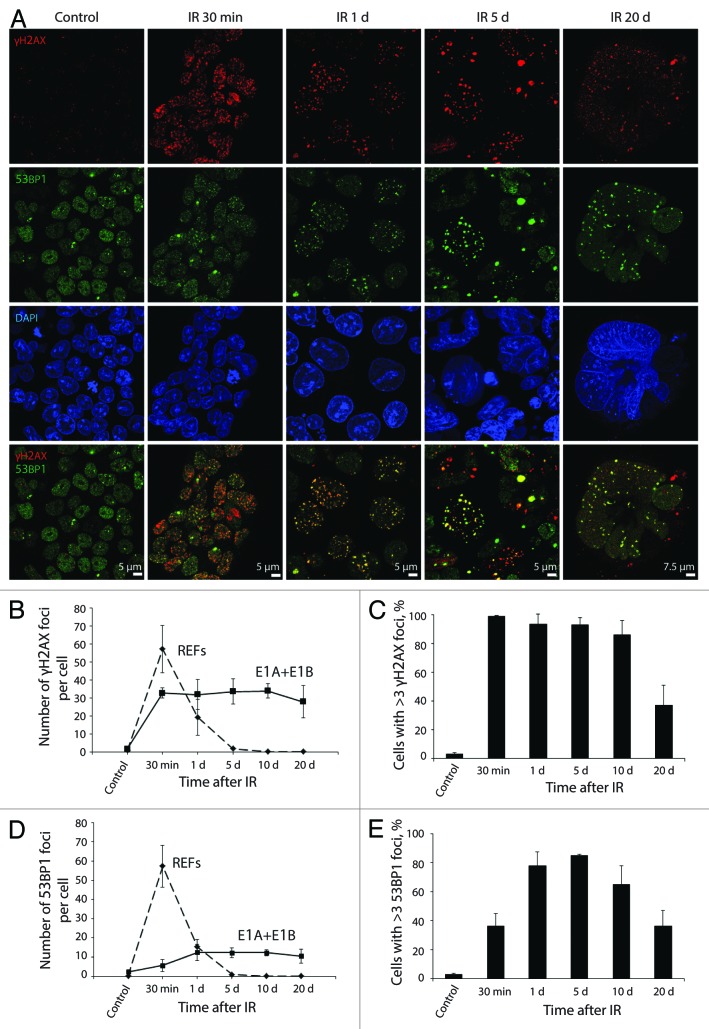
Figure 3. Kinetics of γH2AX and 53BP1 foci formation and resolution in E1A + E1B cells. (A) Colocalization and persistence of γH2AX and 53BP1 foci in E1A + E1B cells after exposure to IR. Cells were irradiated or left untreated and stained with antibodies against γH2AX and 53BP1. Confocal images are shown. (B) Number of γH2AX foci per cell in E1A + E1B cells and REFs. (C) The percentage of cells with γH2AX foci. (D) Number of 53BP1 foci per cell in E1A + E1B cells and REFs. (E) The percentage of cells with 53BP1 foci. Note for (B) and (D): only cells with foci were included in the analysis. Note for (C) and (E): untreated cells contain 0–3 DDR foci per cell; therefore, cells with more than 3 foci were counted. (B–E) Mean data with the standard deviation are shown.

An official website of the United States government
Here's how you know
Official websites use .gov
A
.gov website belongs to an official
government organization in the United States.
Secure .gov websites use HTTPS
A lock (
) or https:// means you've safely
connected to the .gov website. Share sensitive
information only on official, secure websites.
