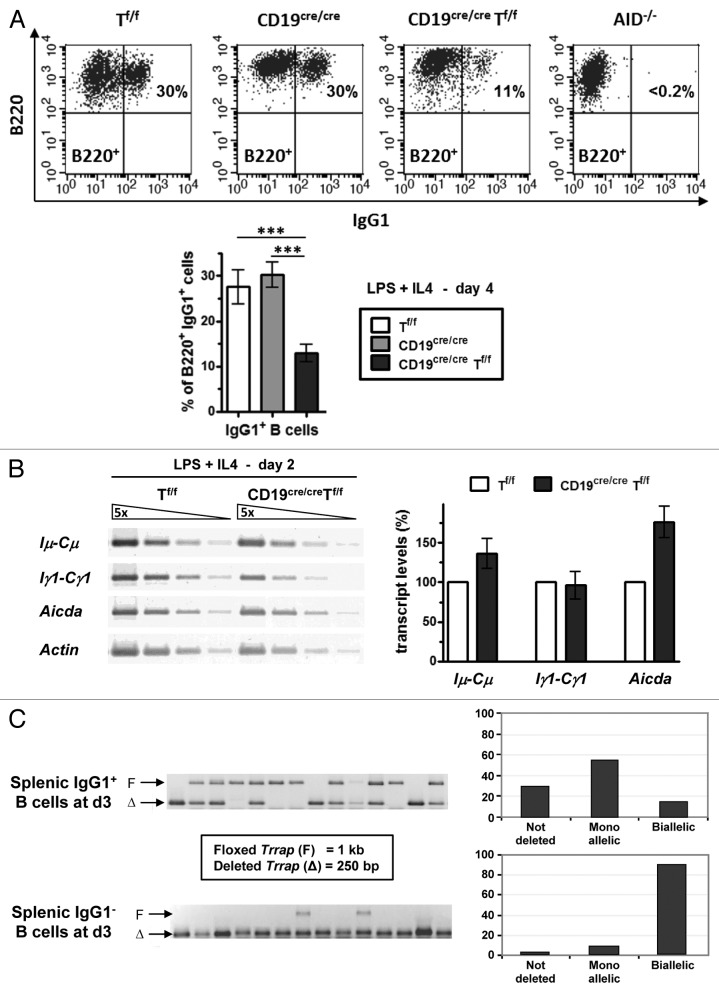
Figure 2. Reduced CSR in the absence of TRRAP. (A) CD43− sorted splenic B cells with the indicated genotypes were induced to switch to IgG1 with LPS+IL4. At day 4 post-stimulation, the cells were stained with anti-B220-APC and anti-IgG1-FITC (top). The statistical data are shown in the bottom panel (n = 7). (B) The levels of GL and Aicda transcripts were estimated by semi-quantitative RT-PCR. Total RNA was prepared at day 2 from LPS+IL4-activated B cells and reverse transcribed. Five-fold serial dilutions of single-strand cDNAs were amplified by using appropriate primers. Actin transcripts were used for normalization (n = 5). (C) Resting B cells were induced to switch for 3 d and stained with anti-IgG1-FITC. The IgG1+ fraction was sorted and analyzed as described in Figure 1B. The histograms show the percentage of deleted alleles among 95 positive wells. The IgG1− fraction was sorted and analyzed as described in Figure 1B. The histograms show the percentage of deleted alleles among 46 positive wells.

An official website of the United States government
Here's how you know
Official websites use .gov
A
.gov website belongs to an official
government organization in the United States.
Secure .gov websites use HTTPS
A lock (
) or https:// means you've safely
connected to the .gov website. Share sensitive
information only on official, secure websites.
