Figure 7.
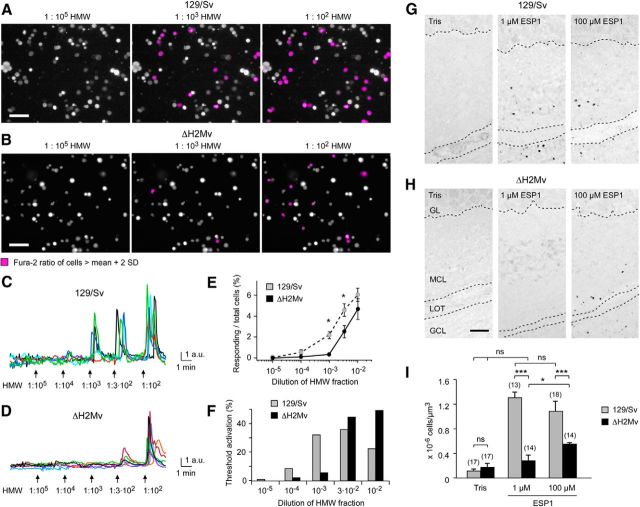
Calcium imaging in populations of dissociated VSNs and c-Fos analysis in AOB. A, B, Images of Fura-2 ratio responses (magenta) superimposed on gray scale Fura-2 images (taken at 380 nm before stimulation) in dissociated VSNs from 129/Sv (A) and ΔH2Mv mice (B). Cells were stimulated with various dilutions of HMW urine fractions. Scale bar, 50 μm. C, D, Concentration dependency of HMW-induced Ca2+ responses to decreasing dilutions of HMW fractions imaged in individual VSNs from 129/Sv (C) or ΔH2Mv (D). Examples from six VSNs per genotype are shown. Arrows indicate the time points at which the 30 s stimulus was turned on. E, The percentage of responding cells over total cells increases with increasing concentrations of HMW fractions (ANOVA: F(4,129) = 43.03, p < 0.0001). Significantly more 129/Sv cells responded at 10−3 and 3·10−2 dilution of HMW urine fraction compared with ΔH2Mv cells (ANOVA: F(1,129) = 12.59, p < 0.01; LSD: *p < 0.01). Data are expressed as means ± SEM. At 10−2 dilution of HMW fraction, there is no significant difference between the two genotypes (LSD: p = 0.16). Criteria for Ca2+ responses in dissociated VSNs: a response is defined as an increase in fluorescence ratio to >1.5-fold of baseline; cells showing a response to control buffer were excluded from analysis, cells that responded to low but not to higher HMW concentrations were excluded and a response had to occur within 30 s after stimulus application. F, Plot of threshold activation, defined as percentage of responsive cells beginning to respond at a given dilution of the HMW urine fraction, in 129/Sv vs ΔH2Mv mice. For each genotype, the percentages of the five bars add up to 100. G, H, Analysis of in vivo c-Fos activation in the AOB of WT or ΔH2Mv females following oronasal exposure to vehicle control (Tris) or 1 or 100 μm ESP1. Sagittal sections derive from the middle third of caudal AOB. GL, Glomerular layer; MCL, mitral cell layer; LOT, lateral olfactory tract; GCL, granule cell layer. Scale bar, 50 μm. I, Quantification of c-Fos positive nuclei in the MCL (n = 3 females per condition and strain). The number of sections evaluated is indicated above each column. ANOVA: F(5,92) = 50.02, p < 0.0001; LSD: ***p < 0.0001; *p < 0.05; ns, not significant. Error bars represent means ± SEM.

