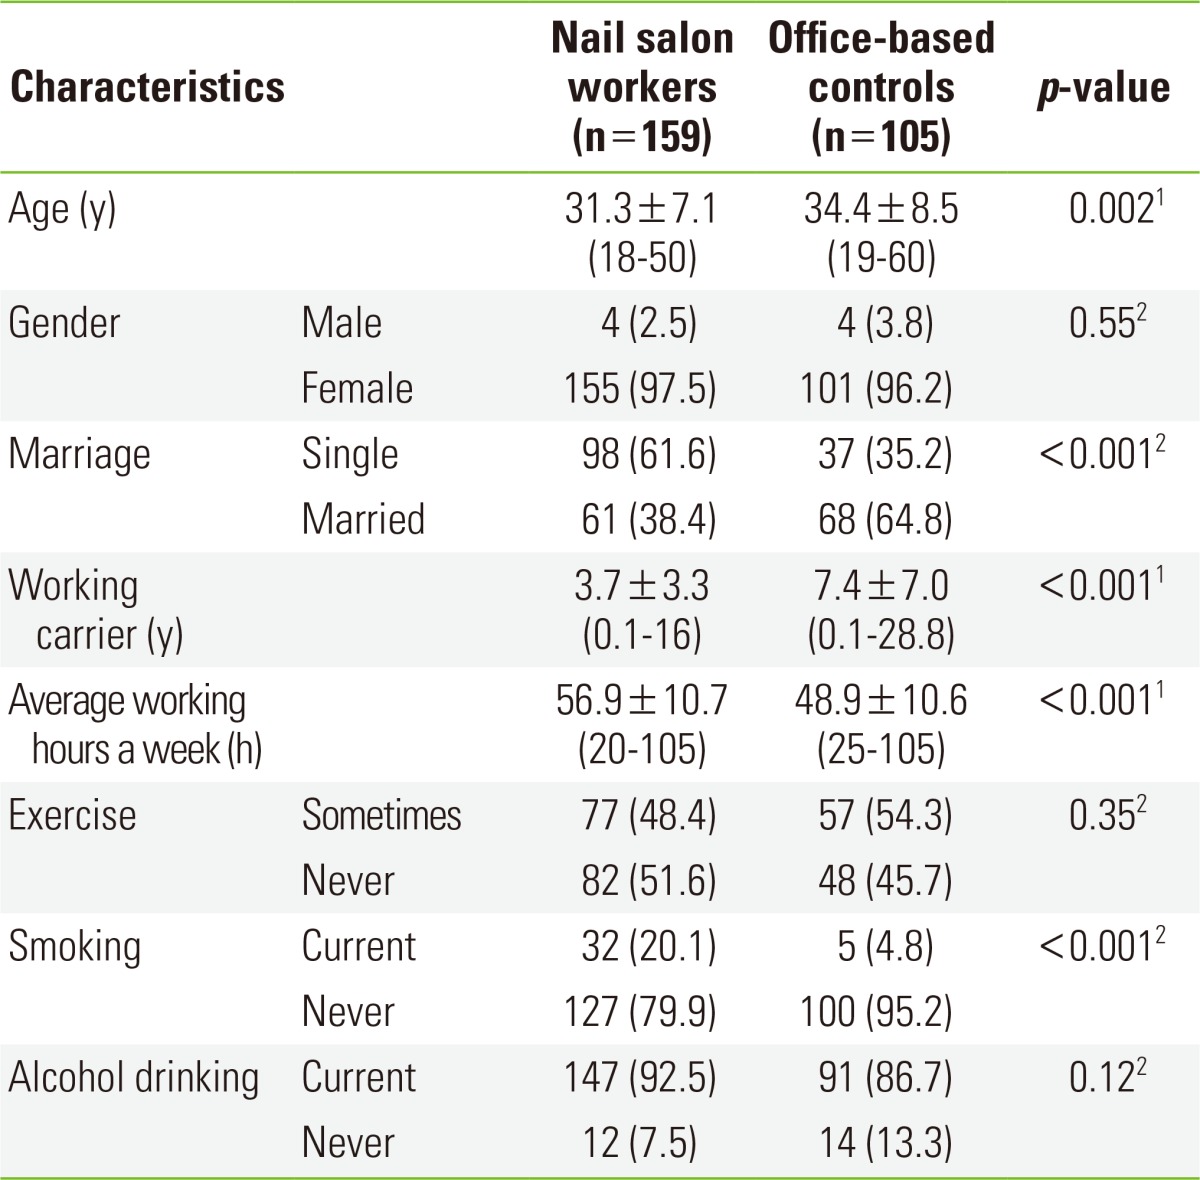
Table 1.
Comparison of characteristics between nail salon workers and office-based controls

Values are presented as mean±SD (range) or number (%).
1t-test for two independent samples.
2Pearson chi-square (cross-tabulation).
Comparison of characteristics between nail salon workers and office-based controls

Values are presented as mean±SD (range) or number (%).
1t-test for two independent samples.
2Pearson chi-square (cross-tabulation).