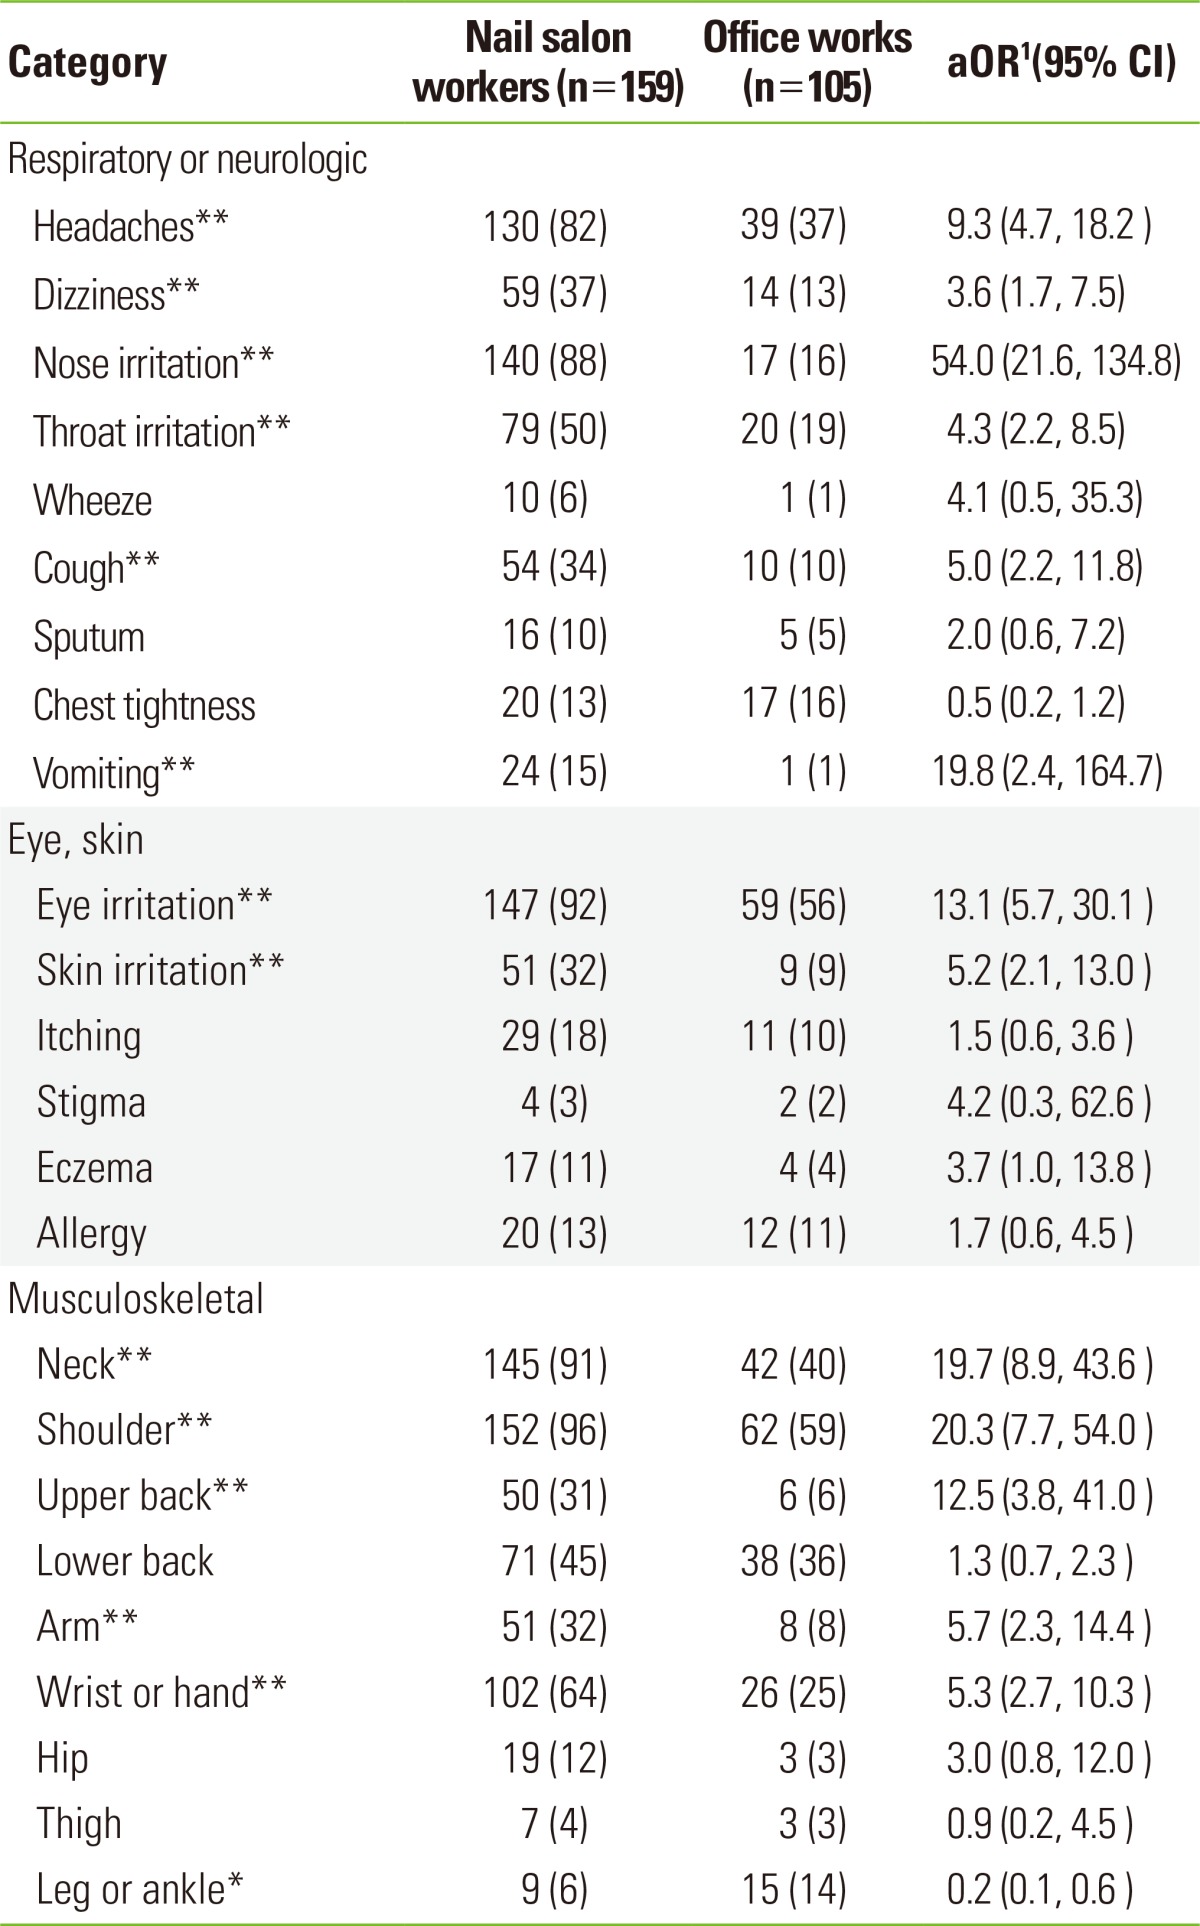
Table 3.
Comparison of work-related symptoms between nail salon workers and office workers

Values are presented as number (%).
aOR, adjusted odds ratio; CI, confidence interval.
1Adjusted for age, marriage, working carrier, average working hours a week, exercise, smoking and alcohol drinking by logistic regression.
*p<0.05, **p<0.01.
