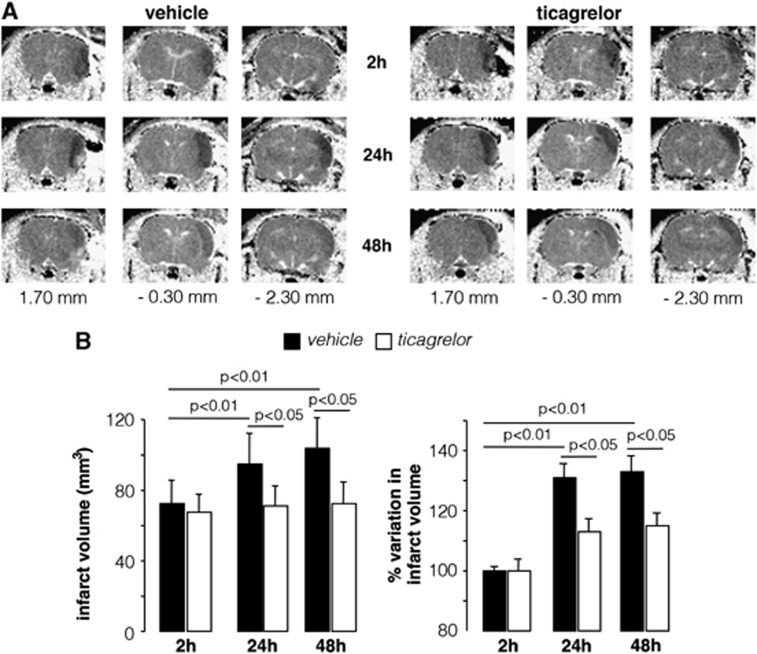
Figure 2.
Time-dependent evolution of infarct volume in middle cerebral artery occlusion (MCAo) rats. (A) Diffusion weight imaging (DWI) representative of rats treated with vehicle or ticagrelor taken at three different anatomic levels (1.70, −0.30, and −2.30 mm from bregma) and at 2, 24, and 48 hours after MCAo. The ischemic lesion is detectable as a hypointese area in the right cerebral hemisphere. (B) Histograms showing the quantitative analysis of the brain damage volume determined by DWI measurements and expressed as absolute value and as percent change relative the initial 2 hours value set to 100%. Data are expressed as mean±s.e.m. for vehicle (n=21) and ticagrelor-treated rats (n=21).

