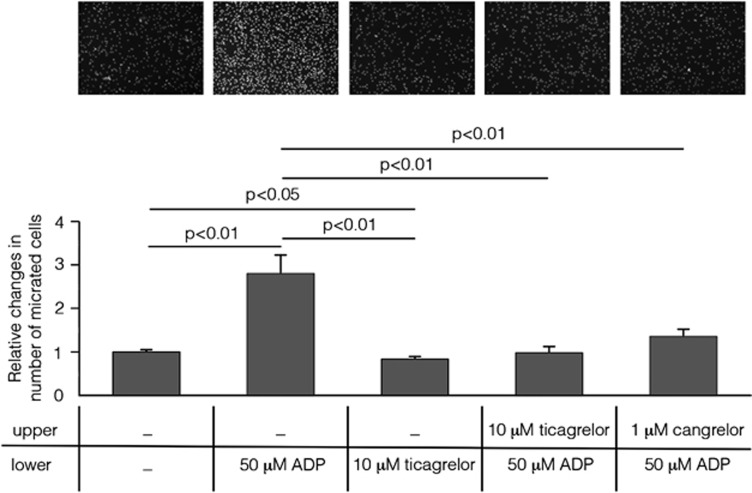
Figure 8.
Ticagrelor abolishes ADP-induced microglial cells migration. Nuclei of cells migrated to the bottom of a polycarbonate membrane stained with Hoechst (top panel). Absolute cell numbers for the typical experiment shown in the picture are as follows (mean of three counted fields in three different wells): Control, unstimulated cells: 234±1; cells stimulated with 50 μmol/L ADP: 860±151; unstimulated cells treated with 10 μmol/L ticagrelor: 191±14; cells stimulated with 50 μmol/L ADP pretreated with 10 μmol/L ticagrelor: 257±136, and cells stimulated with 50 μmol/L ADP pretreated with 1 μmol/L cangrelor: 382±20. Histograms show the results of the quantitative analysis performed in three independent experiments. Data are expressed as mean±s.e.m. and quantification is shown in the histogram. Changes in number of migrated cells were related to control condition set to 1: 1.00±0.04 in control; 2.77±0.44 in cells stimulated with 50 μmol/L ADP; 0.84±0.05 in cells incubated with 10 μmol/L ticagrelor; 0.99±0.12 in cells pretreated with 10 μmol/L ticagrelor and stimulated with 50 μmol/L ADP (statistically not different from control) and 1.36±0.15 in cells pretreated with 1 μmol/L cangrelor and stimulated with 50 μmol/L ADP (statistically not different from control and from ticagrelor pretreatment).

