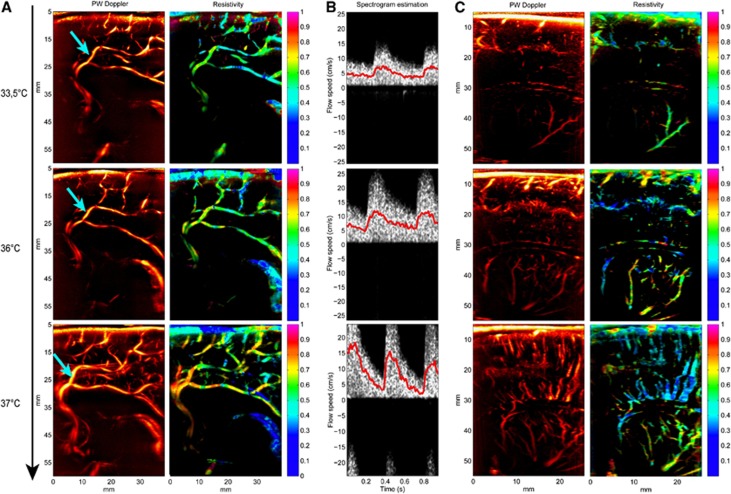
Figure 6.
Monitoring of the cerebral vascular resistivity of a full-term neonate before the end of controlled hypothermia (temperature 33.5°C, day −1), just after the completion of the rewarming process (24 hours after the first acquisition, body temperature 36°C, day 0) and 5 days after (6 days after the first acquisition, body temperature 37°C, day +5). (A) In a medial sagittal plane, the first thing to observe is that the Power Doppler image itself already gives an information: the Doppler signal is really weak under hypothermia (day −1) making only the main big arteries visible, and gets really stronger on day +5 when the baby has recovered a normal temperature. Then, the resistivity map also reveals a really small resistivity index at 33.5°C (precallosal segment of the anterior cerebral artery 0.63±0.05, first segment of the callosomarginal artery 0.66±0.05, posterior pericallosal artery 0.45±0.06), which increases a bit at 36°C (0.68±0.06, 0.69±0.03, 0.57±0.04) and goes back to normal values at 37°C (0.80±0.04, 0.79±0.03, 0.69±0.04). (B) The spectrogram computed in the first segment of the callosomarginal artery (cyan arrow in the Power Doppler image), with speeds corrected with angles 29°, 33°, and 22°, respectively for images of days −1, 0, and +5. During hypothermia (day −1), blood flow is weakly pulsatile and speeds are very low for this kind of vessel. After a partial rewarming, a global increase in the blood flow speeds can be observed, during both systole and diastole. At day +5, the blood flow speed is back to a typical, very pulsatile, high systolic speed profile. (C) Power Doppler image and the corresponding resistivity maps in a parasagittal plane. During hypothermia, small vessels are hardly depicted. Resistivity changes are also observed in the thalamostriate arteries (day −1: 0.41±0.05, day 0: 0.63±0.11, day +5: 0.73±0.10).

