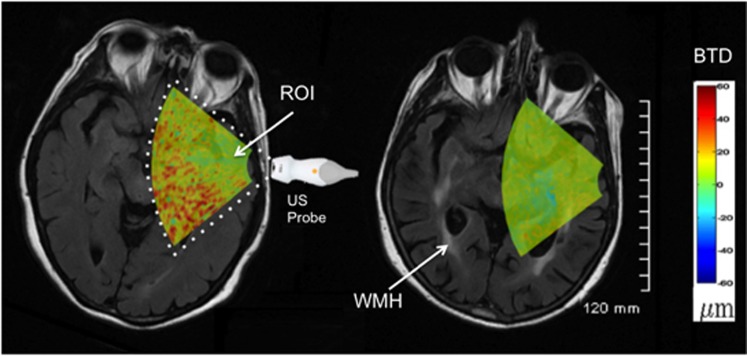
Figure 2.
Axial images representing the brain tissue displacement (BTD) images overlaid on magnetic resonance (MR) images of subjects 2 and 4, reconstructed in parallel with the ultrasound images. For patient 4 (left image), the relative white-matter hyperintensity (WMH) volume was 0%. For patient 2, who had significant WMH (arrows), the relative WMH volume was 0.91%. The color scale indicating BTD amplitude (−60 to +60 μm) is shown on the far right. ROI, region of interest.

