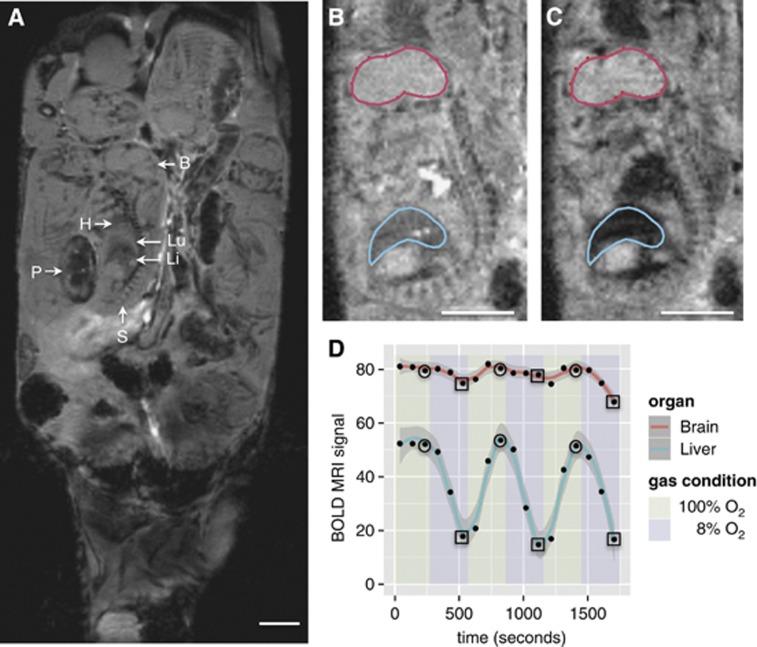
Figure 2.
Fetal mouse blood oxygen level-dependent contrast magnetic resonance imaging (MRI) signal variation with maternal inspired oxygen. (A) Representative coronal anatomic MR image of a 17.5-day gestation dam. Multiple fetuses and placentas are seen in this view. B: brain; H: heart; Li: liver; Lu: lung; P: placenta; S: spine. (B) Representative blood oxygen level-dependent (BOLD) MR image of a fetus showing the placement of regions of interest (ROIs) when the dam is breathing 100% O2 and (C) 8% O2. The decrease in signal intensity (SI) in the liver during hypoxia is clearly visible. (D) Scatter plot showing the absolute BOLD MR signal (arbitrary units) in one of the six dams (B, C) as the inspired oxygen mixture is varied. The smoothing (solid red and blue lines) was performed using LOWESS, a robust locally weighted smoothing algorithm.40 SIhypoxia and SIhyperoxia were determined by calculating the mean of the SI at the final time point of each gas cycle under 8% O2 (squares) and 100% O2 (circles), respectively. Scale bars in (A), (B), and (C)=5 mm.

