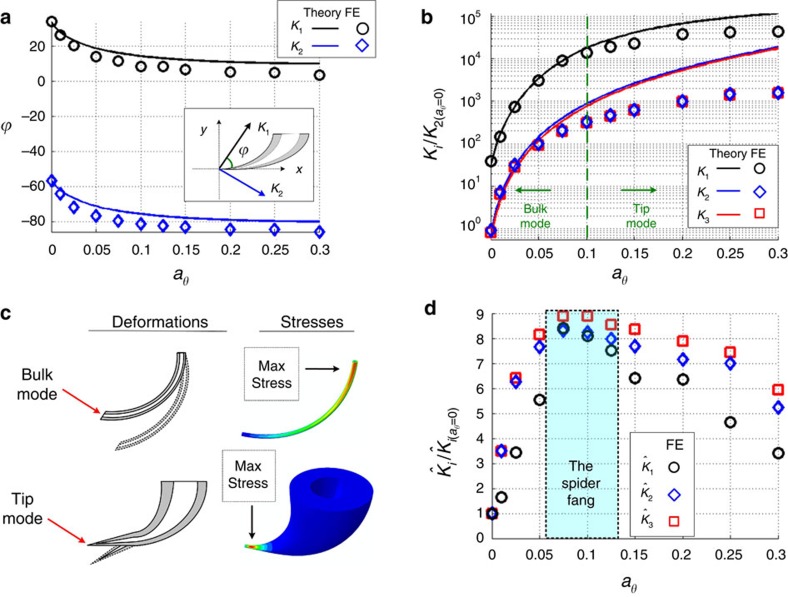
Figure 2. Effects of varying the structural gradient of the fang model on the stiffness parameters.
Calculations and FE simulations for 0≤aθ≤0.3 and a0=0.01. (a) In-plane orientations of the penetration stiffness (K1) and perpendicular stiffness (K2). (b) Stiffness parameters K1, K2, K3, normalized by the perpendicular stiffness of a non-graded architecture. Regions of the bulk-dominant and tip-dominant modes are indicated. (c) Deformations and stress distributions of the bulk and tip modes. Deformations are schematically illustrated for clarity; stress distributions (von-Mises) are obtained by FE simulations (see Supplementary Information). (d) Specific stiffness parameters,  , normalized by the corresponding specific stiffness of the non-graded architecture. The rectangular region indicates the range of the natural fang architecture.

