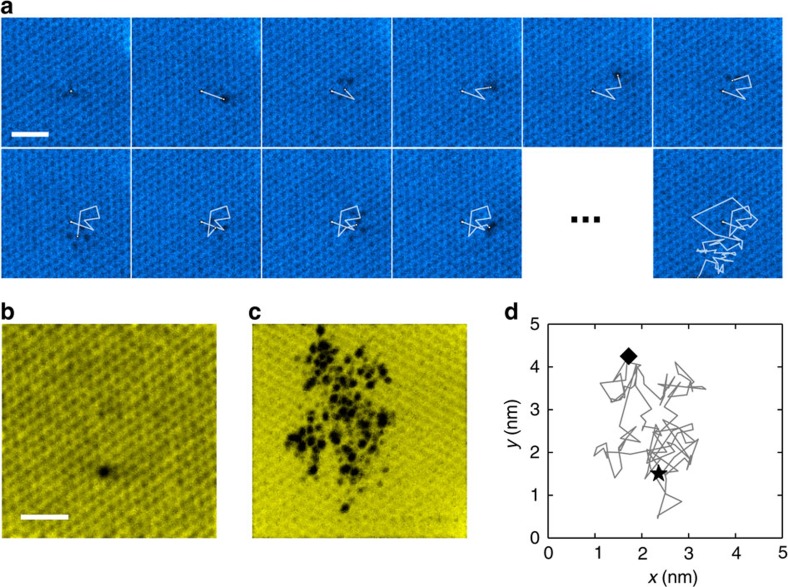
Figure 1. Travelling divacancy in graphene.
(a) Ten consecutive frames and the final frame from one image sequence showing the movement of the defect through the lattice. (b) First frame of another image sequence. (c) ‘Superposition’ of all of the frames from the second sequence highlighting the trace of the defect by showing the minimum intensity from the sequence at every pixel. (d) Actual trajectory of the defect in the second sequence, determined by locating the approximate middle point of the defect in every frame. Only those images where the location of the defect was clearly identifiable have been included. The start position is marked with a black star and the last location with a diamond. All scale bars are 1 nm.

