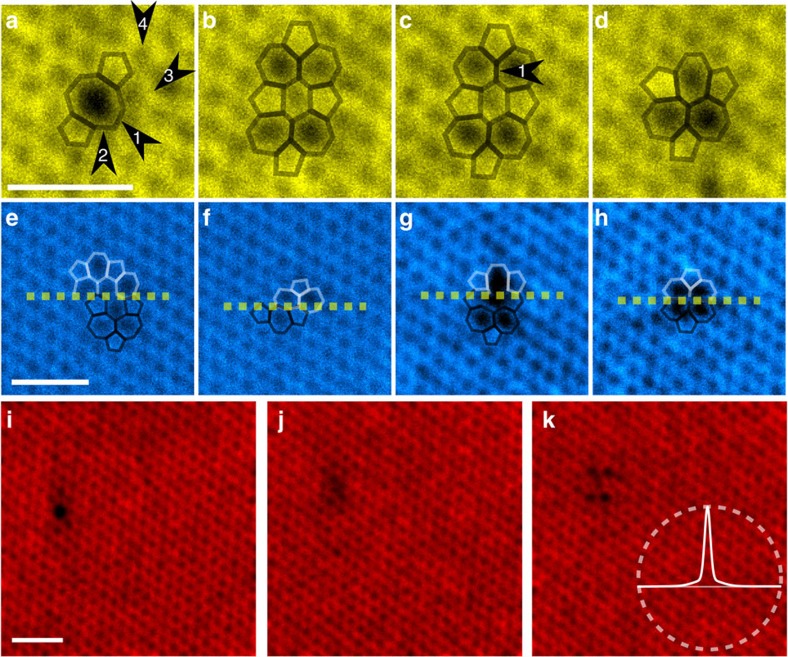
Figure 2. Example exposures of the defect.
(a–d) Four consecutive frames from the second image sequence. The bonds associated with the defects are highlighted with an overlay. The structure has undergone at least four bond rotations between panels a and b and one between c and d, as marked with the black arrows. (e–h) Examples of image scans where the structure changed while scanning exactly at the location of the defect. White and black overlays mark the structure of the defect before and after the change, respectively. (i–k) Three consecutive frames from the second image sequence. The defect appears in the V2(585) configuration in panel i, but disappears for the duration of the next scan resulting in panel j, before appearing again in panel k, in the V2(5555-6-7777) configuration. The darker area within panel j presumably corresponds to the area where the defect is located, although it avoids detection (locations of all atoms belonging to the pristine lattice can be identified). In panel k, a circle with radius of 1.5 nm is drawn for scale with the experimentally obtained probe shape. In these panels the complete field of view is shown. The scale bars are 1 nm.

