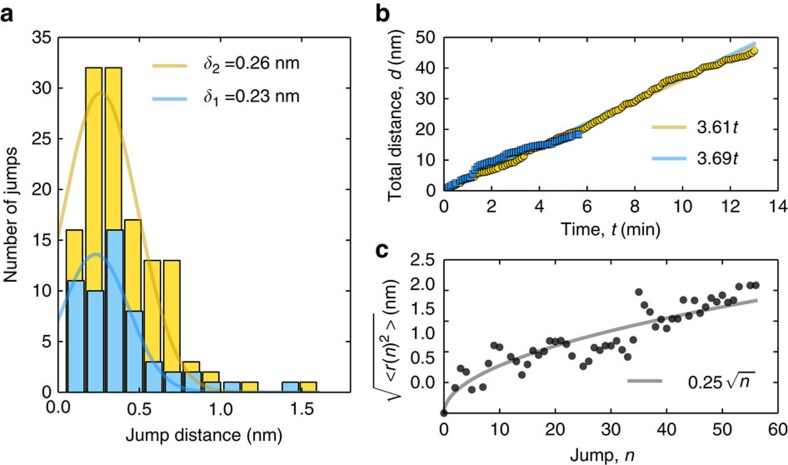
Figure 4. Statistical analysis of a random walk.
(a) Histograms of all of the jump distances by the defect in the two image sequences. The lines show normal distributions fitted to the data. (b) Corresponding cumulative total distance travelled by the defect as a function of time. The lines are fits to the data. (c) Root-mean-square distance of the defect from the starting position as a function of time. The solid line is a fit to the data.

