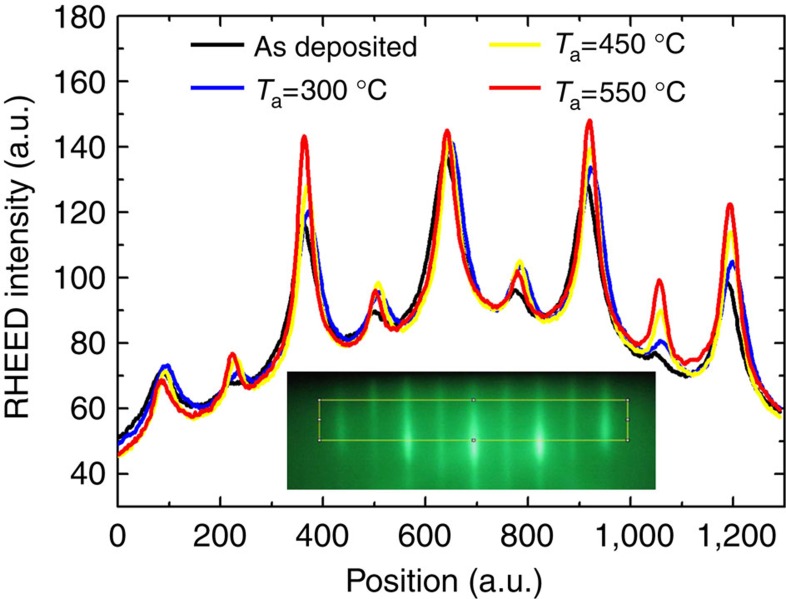
Figure 1. RHEED intensities of Co2MnSi (100) thin films.
The intensities for samples with different annealing temperatures Ta are evaluated from the area of the RHEED image indicated by the yellow rectangle in the inset. The inset shows the 0th order region of the RHEED image of a Co2MnSi thin film annealed at 450 °C. The low intensity maxima indicate the doubling of the unit cell (compared with the B2 cell) generated by L21 order.

