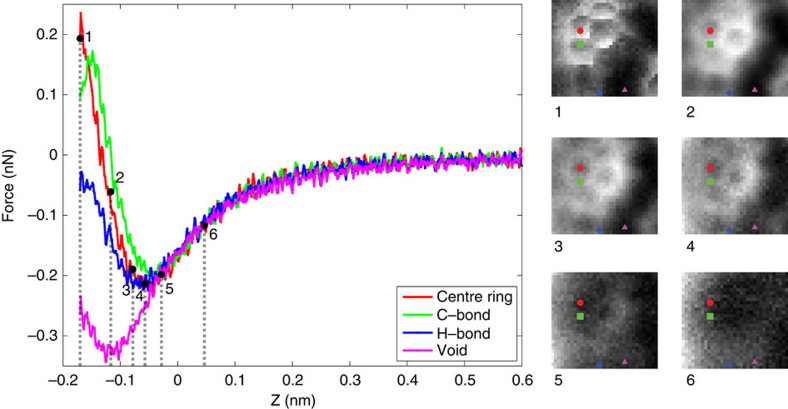
Figure 2. Quantifying the short-range forces responsible for intermolecular contrast.
Short-range force curves for a H-bonded NTCDI molecule in a 2D assembly, which were acquired at the centre of a carbon ring, above a C–C bond, above a hydrogen bond region, and in a void region between the molecules are plotted in red, green, blue and purple, respectively. The curves were extracted from a spectroscopy grid acquired at 5 K. Slices through the spectroscopy grid acquired at the z values labelled as 1–6 on the force curves are shown as images 1–6 to the right. Note, in particular, the absence of intra- and intermolecular contrast in the region of the force curve where the force gradient is positive. Distinct intermolecular contrast appears only when the force gradient becomes negative, that is, when the repulsive component of the tip-sample interaction is sufficiently large to cause the force gradient to change sign. The oscillation amplitude here was 110 pm.

