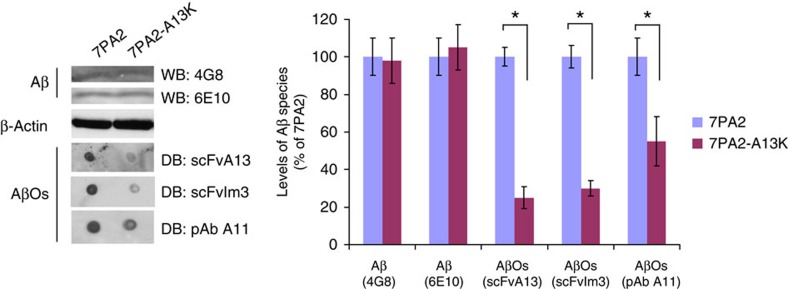
Figure 4. The intracellular Aβ and AβOs in 7PA2-A13K cells.
WB analysis of Aβ (blot with 6E10 and 4G8) and DB analysis of AβOs (blot with the anti-AβOs scFvA13 and scFvIm3 and with the generic anti-oligomers pAbA11) in 7PA2 and 7PA2-A13K cell lysates. In WB, the Aβ monomeric bands do not show significant changes (nor in total microsomes, see Supplementary Fig. 7b). The intracellular AβOs, measured by scFvA13 or scFvIm3 or pAbA11 DB on cell lysates, show significantly decreased levels in 7PA2-A13K cells in comparison with 7PA2 cells. The histogram shows the Aβ and AβO levels in 7PA2-A13K lysates in comparison with 7PA2 cells (at 100) obtained from densitometric values of bands and dots and normalized versus β-Actin and versus the amount of total proteins in lysates. Mean values±s.e.m., n=3, *P<0.01, Student’s t-test.

