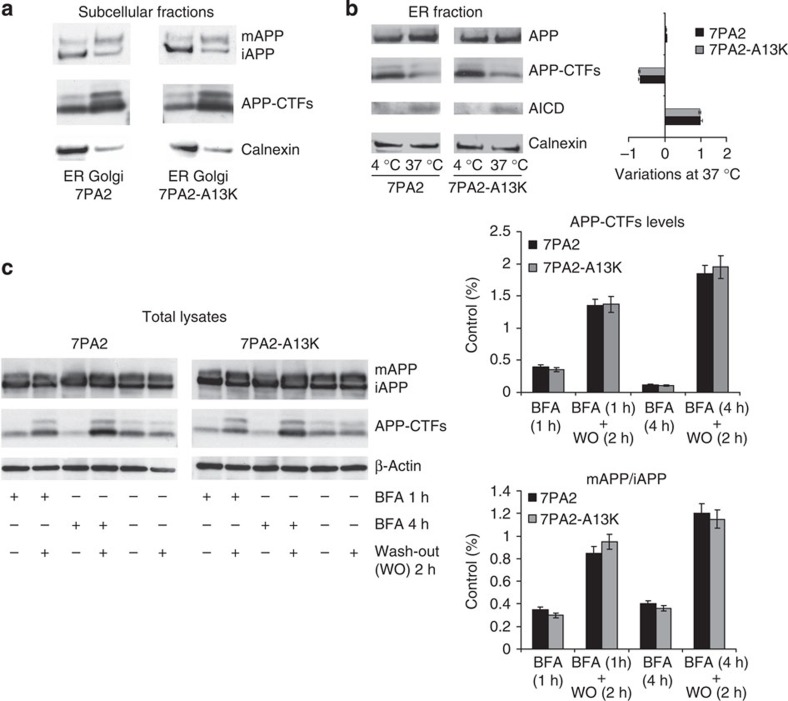
Figure 6. The scFvA13-KDEL does not alter the subcellular maturation and processing of APP.
(a) WB analysis (anti-APP C-terminal) of the compartment-specific APP maturation and processing in representative subcellular fractions (ER or Golgi enriched) of 7PA2 and 7PA2-A13K cells. The ER and Golgi specificities (such as the different ratio i-APP/m-APP, and the different CTFs levels) are similar in 7PA2 and 7PA2-A13K cells. (b) γ-secretase activity in subcellular ER-enriched fractions of 7PA2 and 7PA2-A13K cells assayed by WB (anti-APP C-terminal). Freshly prepared ER-enriched fractions are incubated for 2 h at 37 °C or at 4 °C, to allow (37 °C) or not (4 °C) specific γ-secretases APP cleavages at the γ- and ε-sites, respectively measured by the selective reduction of the APP–CTFs C99-C83 (but not of the full-length APP) and by the appearance of the AICD. The histogram shows the variations at 37 °C of APP, APP–CTFs and AICD (densitometric values of WB bands normalized versus calnexin). Mean values±s.e.m., n=3. No significant differences between 7PA2 and 7PA2-A13K cells were observed. (c) Total cell lysates WB analysis of APP and APP–CTFs (anti-APP C-terminal), in experiments of reversible block of intracellular trafficking from ER to Golgi complex: transient (1 or 4 h) BFA treatment induces a reduction of APP–CTFs, which can be completely reversed after a 2 h BFA washout. The reduction of APP–CTFs is indicative of γ-secretase processing, whereas the re-establishment (or de novo generation) of CTFs levels is indicative of α-, β-secretases activities. The upper histogram shows the variations at of APP–CTFs (densitometric values of WB bands normalized versus β-Actin, and represented as % of corresponding control). Mean values±s.e.m., n=3. No significant differences between 7PA2 and 7PA2-A13K cells were observed. In addition, as expected, 1 or 4 h BFA treatment blocks also the maturation of the full-length APP. The lower histogram shows the variations of the ratios m-APP/iAPP (calculated from densitometric values of WB bands normalized versus β-Actin, and represented as % of corresponding control). Mean values±s.e.m., n=3. No significant differences between 7PA2 and 7PA2-A13K cells were observed.

