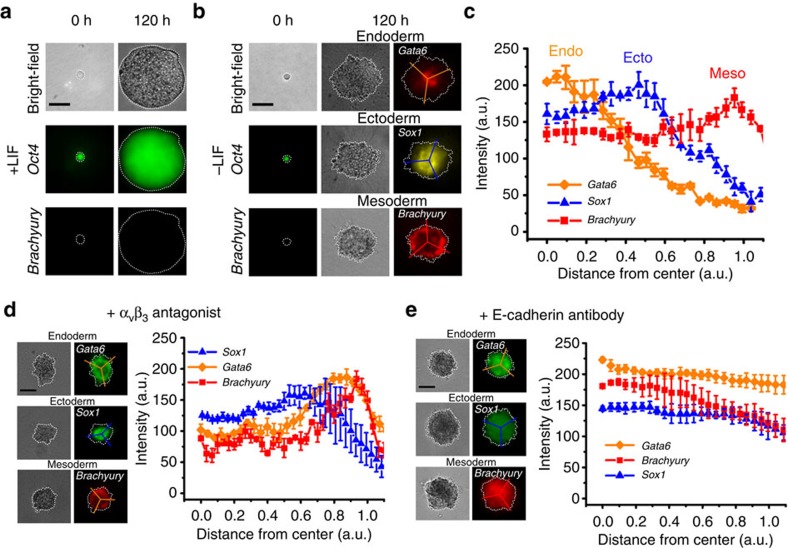
Figure 1. Soft fibrin gels promote organization of germ layers.
(a) Representative bright-field (top) and fluorescence (middle and bottom) images of a single ESC cultured in soft 3D fibrin gels in the presence of LIF (0 h) that formed a round spherical colony in 5 days (120 h). Strong EGFP fluorescence was observed (middle, ‘Oct4’), whereas no DsRed fluorescence was observed (bottom, ‘Brachyury’). (b) Representative images of a single ESC cultured in soft fibrin gels without LIF (0 h, the bright-field image is on the top and the fluorescence images on the middle and bottom, left column) that formed a colony with organized germ layers in 5 days (middle and left columns). Middle: bright-field images of colonies grown from three single cells; right: the presence of endo- and ectodermal cells was detected by immunofluorescence microscopy using anti-Gata6 and Sox1 antibodies, respectively, whereas DsRed fluorescence indicated the differentiation of mesodermal cells (Brachyury). Lines were used to acquire the fluorescence intensity data shown in (c). (c) Quantification of germ layer organization along with 0 (at the centre core) and 1 (at the colony boundary) arbitrary unit (a.u.) based on lines drawn on the fluorescence images on the left in (b). Mean±s.e.m. (d) Representative bright field (left) and fluorescence (middle) images and quantification of different germ layer markers (Sox1, Gata6 and Brachyury) 5 days after αvβ3 antagonist treatment (right). Single ES cells were treated with 20 μg ml−1 of αvβ3 antagonist for 5 days in −LIF medium. Note that the endoderm layer was located at the outer periphery of the colony. Mean±s.e.m. (e) Representative bright-field (left) and fluorescence (middle) images in –LIF condition 5 days after anti-E-cadherin antibody (2 μg ml−1 final concentration) treatment to block E-cadherin–E-cadherin adhesion. Germ layer organization was completely blocked. Quantification of different germ layer markers is shown on the right. Mean±s.e.m.; similar biological replicates of immunofluorescence staining were obtained from at least three independent experiments for each subfigure. W4 cells were used in all figures except for a and the mesoderm layer in b where OGTR1 cells were used. Scale bars, 50 μm.

