
Fig. 1.
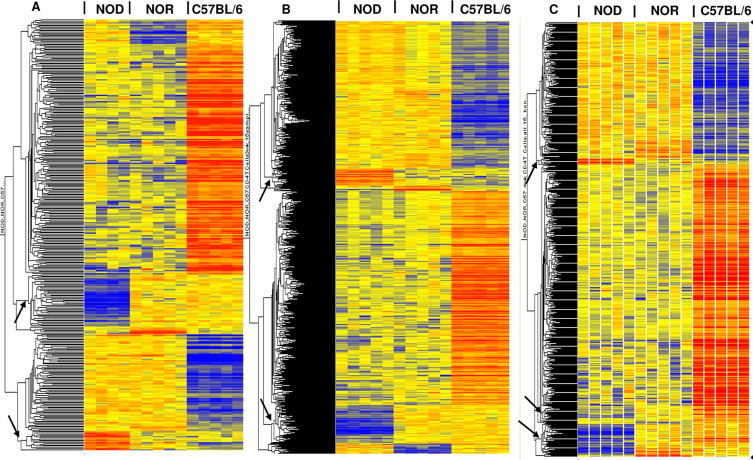
Hierarchical clusters of genes whose expression was altered in CD4 T-cells. 362 (A), 982 (B) and 581 (C) genes were differentially expressed between strains at 2, 3, and 4 weeks of age, respectively. The lists were identified by a one-way ANOVA of ~31,000 filtered probe sets at p < 0.005, with Benjamini–Hochberg multiple test correction. A total of 58, 115, and 65 probe sets were differentially expressed in NOD relative to both controls (NOR and C57BL/6) at 2-, 3- and 4-weeks, respectively; clusters of these NOD altered genes are indicated by arrows. The color intensity of the rectangles representing each gene for each sample (n = 5 for each strain/age, except NOD 2 week, where n = 4) indicates the degree of increase (red) or decrease (blue) of the gene expression signal relative to the mean signal intensity (yellow).