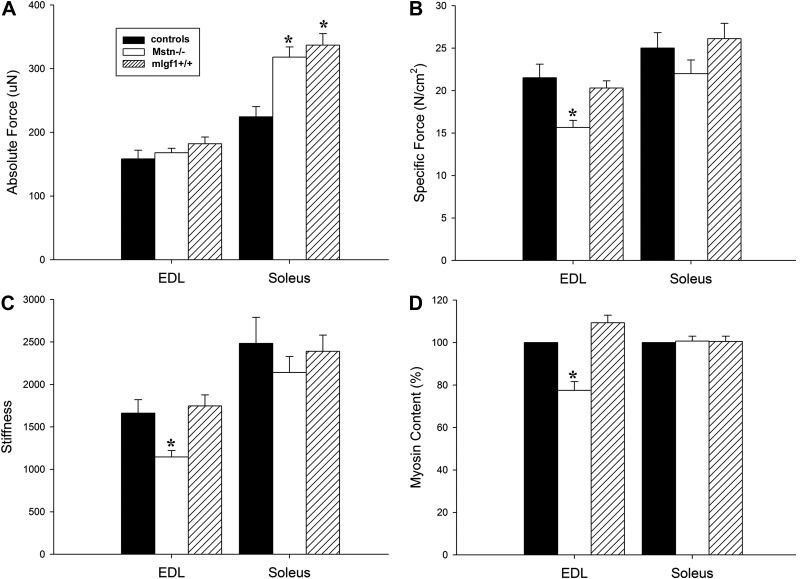
Figure 5.
Single muscle fiber absolute force (A), specific force (B), and stiffness (C) together with myosin content, described as percentage (D). Results from single muscle fibers expressing the type IIb MyHC isoform in the EDL and the IIa MyHC isoform in the soleus are included. Values are means ± se. *P < 0.05 vs. control; 1-way ANOVA.

