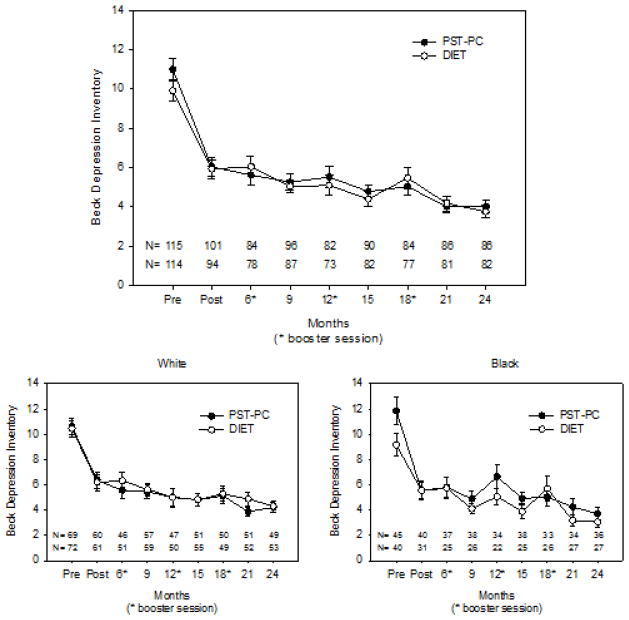
Figure 1. Trajectories of Beck Depression Inventory Scores in PST-PC and DIET.
Participants in both PST-PC and DIET demonstrated similar improvement in depressive symptoms (BDI). Improvements were sustained over two years. There was a significant quadratic and linear time effects (F(1,1356)=75.91, p<.001 and F(1,1356)=159.57, p<.001 respectively), but no significant intervention or intervention by time effects (F(1,1356)=2.49, p>.114 and F(1,1356)=.46, p>0.496). When examining race as moderator, we observed baseline difference in blacks between interventions; thus, we ran the model co-varying for baseline score. We detected significant time effect (F(1,1115)=26.78, p<.001) for post-intervention through 2 years, but no significant race, race*intervention or race*time effects.

