
Figure 4.
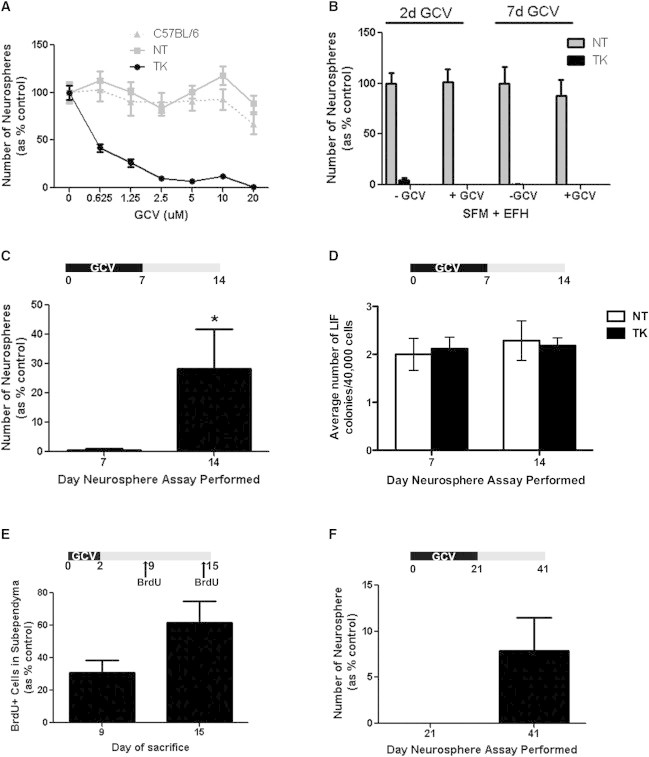
GFAP-TK Model Specifically Ablates Dividing GFAP+ Cells In Vitro and In Vivo
(A) GCV dose response curve in vitro (n = 2 independent experiments).
(B) Two- or 7-day GCV infusion in vivo followed by immediate sacrifice with cells plated in EFH in the absence (−) or presence (+) of GCV in vitro (n ≥ 5 mice/group).
(C and D) Seven-day GCV infusion (n ≥ 3 mice/group) followed by plating in (C) EFH to assay GFAP-expressing adult NSCs or (D) LIF-only to assay for AdpNSCs.
(E) BrdU+ cells in the SE after 2-day GCV infusion (n = 3 mice/group).
(F) EFH neurosphere assay after 21-day GCV infusion (n = 3 mice/group).
Data are shown as mean ± SEM; ∗p ≤ 0.05. See also Figure S3.