
Figure 2.
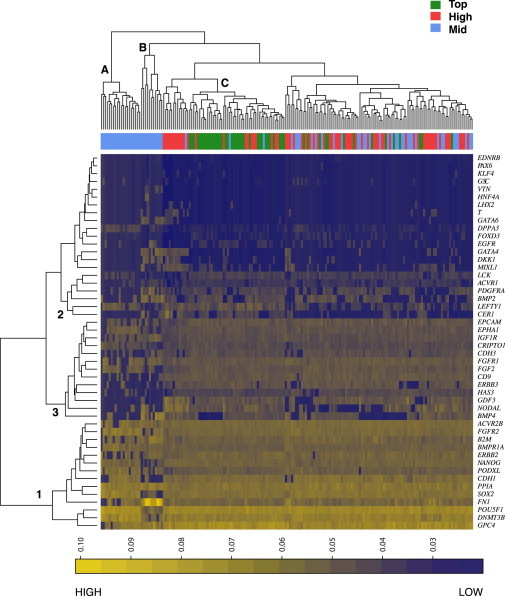
Hierarchical Cluster Analysis of Single-Cell Gene Expression Analysis of Human ESC Subpopulations Grown in mTeSR and Isolated by FACS
Cells grown in mTeSR condition were separated and analyzed as in 1 but analyzed by hierarchical clustering. Color scale bar depicts 1/CT values as in Figure 1. Cell clusters referred to in text are identified by letters, and gene clusters are identified by numbers. See also Table S1.