
Figure 5.
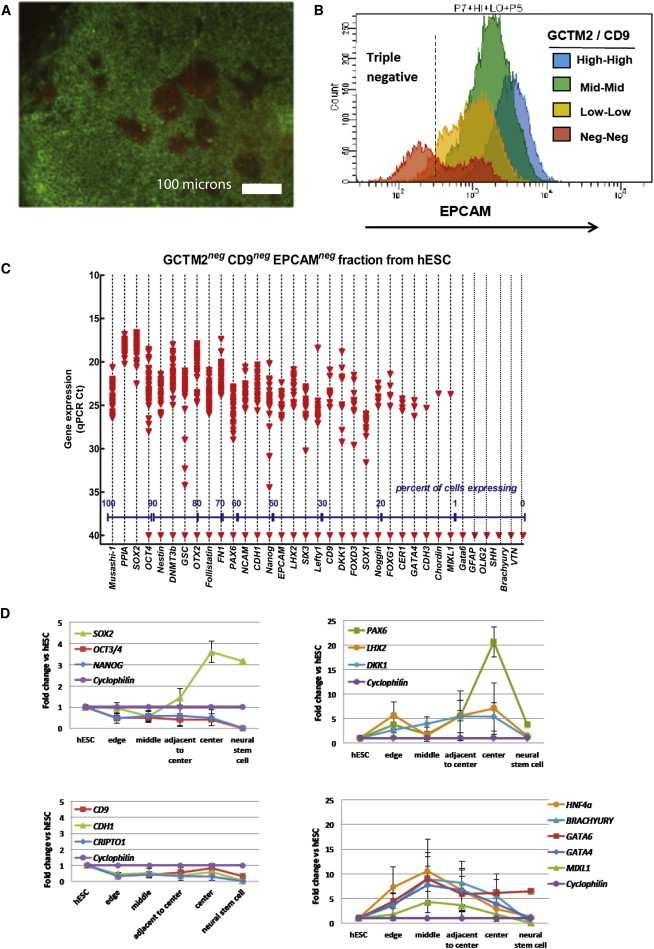
Lineage Primed Subpopulations of Human ESCs
Cells grown in serum and undergoing priming for neural specification were isolated on the basis of immunostaining (A–C) or position in the colony, and their gene expression was analyzed by single-cell qRT-PCR or in embryoid body differentiation assays (D).
(A and B) Expression of EPCAM and PAX6 proteins. (A) Immunocytochemical localization of EPCAM (green) and PAX6 (red) in HES3 colonies cultured in FBS. Clusters of PAX6-positive EPCAM-negative cells are localized near the center region of the colony. (B) Distribution of EPCAM staining in HES3 cells across each of four GCTM2/CD9 populations as determined by FACS. The triple-negative cells (GCTM2, CD9, EPCAM negative) were collected for analysis of gene expression by single-cell qPCR.
(C) Density dot plot of single-cell gene expression from the triple-negative population of hESC isolated by FACS. Expression values are given as qPCR cycle threshold (Ct), with 15 being high expression and a cutoff of 28 Ct assigned as the lowest level of reliably detectable expression (red dashed line). Ct values of 40 indicate no amplification detected within 40 qPCR cycles. Each data point represents a single-gene/cell qPCR. The percentages of single cells expressing a given gene within each population (based on a cutoff of 28 Ct) are provided along the x axis.
(D) Gene expression in aggregate suspension cultures of small ESCs clumps from the edge, middle, adjacent to center, and center regions of colonies grown in FCS. y axis shows the fold change relative to undifferentiated ESCs; values for neural stem cells are shown for comparison. Aggregates from edge or middle region show multilineage capacity whereas cells from adjacent center or center show high levels of PAX6 and LHX2 transcripts. Values are mean ± SE of three biological replicates.
See also Figures S2–S5 and Tables S2 and S3.