
Figure 1.
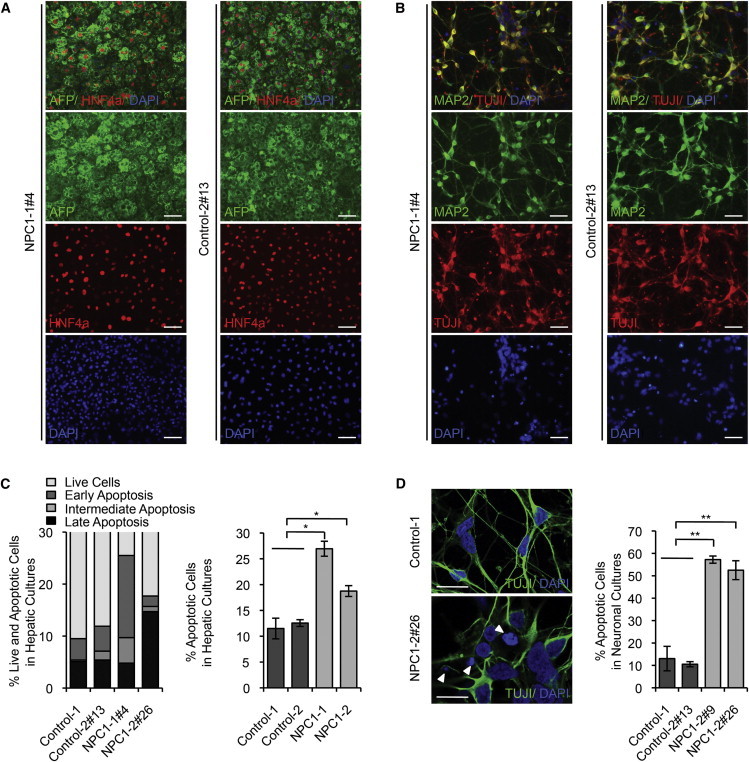
Generation and Characterization of Patient-Specific NPC1 iPSCs
(A) Immunofluorescence staining of hepatic cultures derived from representative NPC1 iPSC lines 21 days after induction of hepatocyte differentiation for Alpha-fetoprotein (AFP; green) and HNF4a (red). Nuclei were stained with DAPI (blue). Scale bar, 100 μm.
(B) Immunofluorescence staining of neuronal cultures derived from representative NPC1 iPSC lines 14 days after induction of differentiation for neuron-specific microtubule-associated protein 2 (MAP2; green) and class III β-tubulin (TUJI; red). Nuclei were stained with DAPI (blue). Scale bar, 100 μm.
(C) FACS analysis of cell viability and apoptosis in control and NPC1 iPSC-derived hepatic cultures measuring FITC-Annexin V and propidium iodide staining. Graphical data (right panel) represent mean ± SE (n = 3).
(D) Analysis of cell death in control and NPC1 iPSC-derived 5-week-old TUJI positive neurons. Nuclei stained with DAPI. Arrow shows apoptotic nuclei. Scale bar, 10 μm. Graphical data represent mean ± SE (n = 3).
Results shown are representative of at least three independent experiments using two different clones of each line unless otherwise indicated. ∗∗∗p < 0.001; ∗∗p < 0.01; ∗p < 0.05; ns, nonsignificant.