
Figure 4.
Genetic Correction of Autophagy Phenotype in NPC1 iPSC-Derived cells
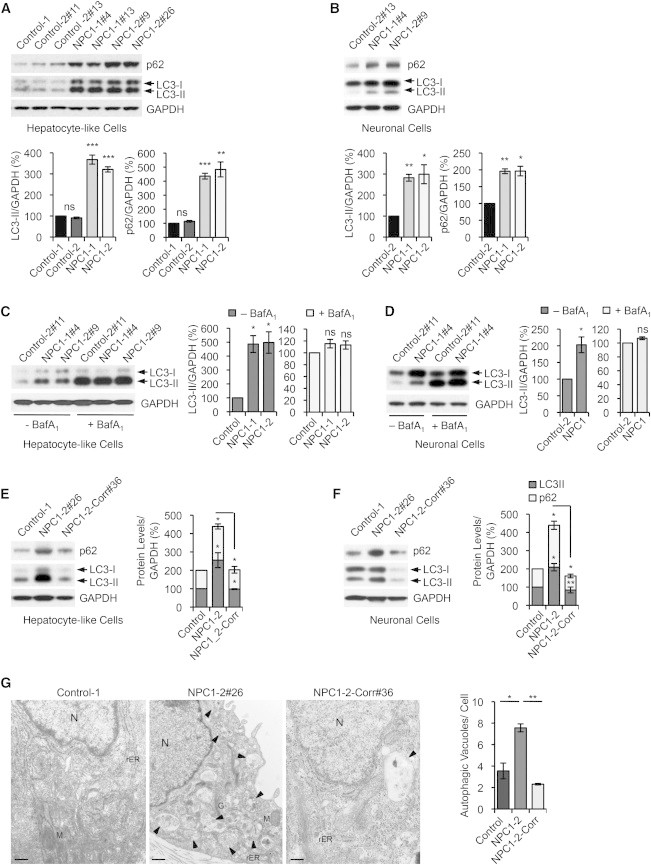
(A and B) Immunoblot analysis and quantifications of p62 and LC3-II levels using anti-p62, anti-LC3, and anti-GAPDH antibodies in hepatic (A) and neuronal cultures (B) derived from indicated control and NPC1 iPSC lines. Graphical data represent mean ± SE (n = 4).
(C and D) Immunoblot analysis and quantification of LC3-II levels using anti-LC3 and anti-GAPDH antibodies in hepatic (C) and neuronal cultures (D) derived from control and NPC1 iPSC lines, treated with or without 400 nM bafilomycin A1 (BafA1) for 4 hr. Graphical data represent mean ± SE (n = 3).
(E and F) Immunoblot analysis and quantifications of p62 and LC3-II levels in hepatic (E) and neuronal cultures (F) derived from the NPC1-2 iPSC line after correction of the NPC1I1061T mutation. Graphical data represent mean ± SE (n = 3).
(G) Electron microscopy images of representative NPC1 iPSC-derived hepatic-like cells before and after genome editing. Arrows are indicating autophagic vacuoles. Graphical data represent mean ± SE (n = 3). Nucleus (N), rough endoplasmatic reticulum (rER), mitochondria (M), Golgi (G). Scale bar, 500 nm.
Results shown are representative for at least three independent experiments using two different clones of each line. ∗∗∗p < 0.001; ∗∗p < 0.01; ∗p < 0.05; ns, nonsignificant.