
Figure 5.
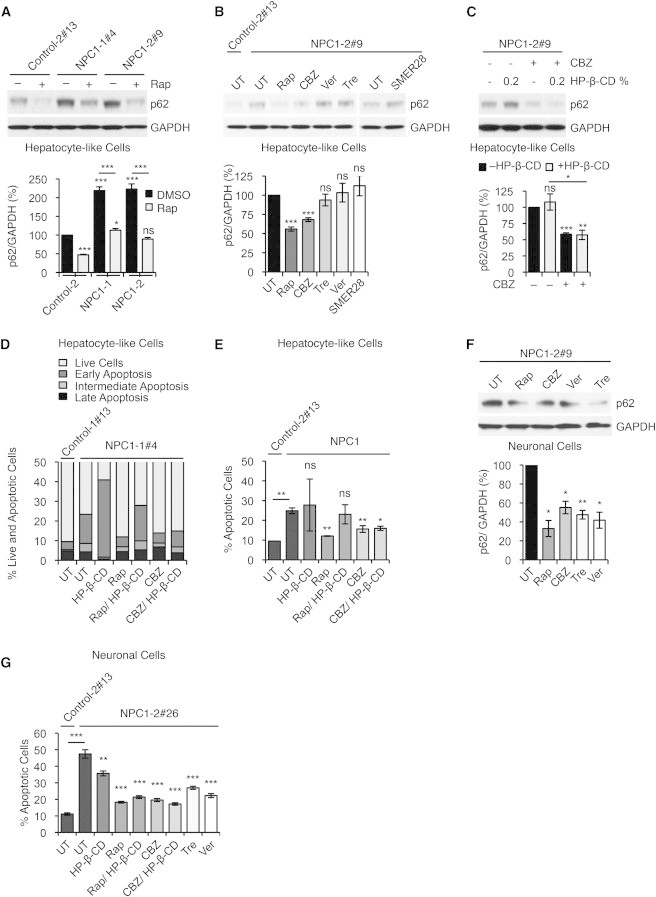
Chemical Correction of Autophagy Phenotype in NPC1 iPSC-Derived cells
(A) Immunoblot analysis and quantification of p62 levels using anti-p62 and anti-GAPDH antibodies in control and NPC1 iPSC-derived hepatic cultures, treated with either DMSO (vehicle control) or rapamycin (Rap). Graphical data represent mean ± SE (n = 3).
(B) Immunoblot analysis and quantification of p62 levels using anti-p62 and anti-GAPDH antibodies in control and NPC1 iPSC-derived hepatic cultures after treatment with autophagy inducing compounds: untreated (UT), rapamycin (Rap), carbamazepine (CBZ), verapamil (Ver), trehelose (Tre), and SMER28. Graphical data represent mean ± SE (n = 3).
(C) Immunoblot analysis and quantification of p62 levels using anti-p62 and anti-GAPDH antibodies in NPC1 iPSC-derived hepatic cultures, treated with CBZ and HP-β-CD as indicated. Graphical data represent mean ± SE (n = 3).
(D and E) FACS analysis of cell viability and apoptosis in NPC1 iPSC-derived hepatic cultures after treatment with indicated compounds measuring FITC-Annexin V and propidium iodide staining. (E) Graphical data represent mean ± SE (n = 3).
(F) Immunoblot analysis and quantification of p62 levels using anti-p62 and anti-GAPDH antibodies in NPC1 iPSC-derived neuronal cultures after treatment with autophagy inducing compounds: untreated (UT), Rap, CBZ, Ver, and Tre. Graphical data represent mean ± SE (n = 3).
(G) Analysis of cell death in NPC1 iPSC-derived 5-week-old neurons by assessing fragmented and TUNNEL positive nuclei. Graphical data represent mean ± SE (n = 6).
Results shown are representative for at least two independent experiments using two different clones of each line. ∗∗∗p < 0.001; ∗∗p < 0.01; ∗p < 0.05; ns, nonsignificant.