
Figure 4.
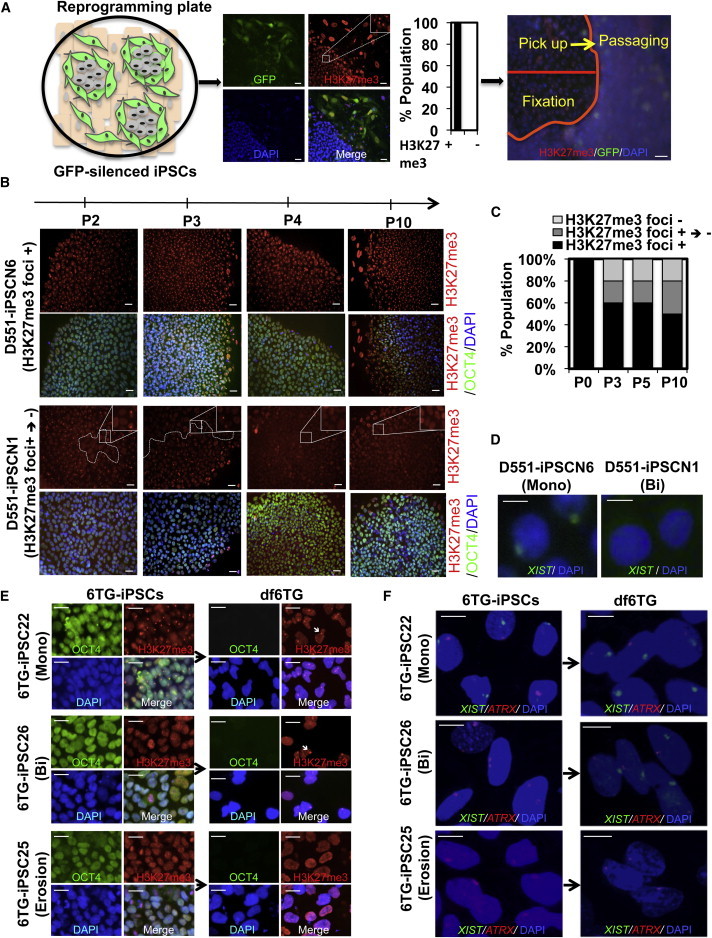
Formation of Class I and Class III iPSC Clones in Early Passaging
(A) Schematic of tracing the X chromosome after reprogramming. iPSCs undergo rapid XCI upon completion of reprogramming, and all GFP-silenced nascent iPSC colonies display H3K27me3 foci. In order to trace the X chromosome status after reprogramming, half of the colonies were fixed and half were used for passaging. Scale bar, 20 μm.
(B) Appearance of H3K27me3 foci-negative cells in iPSC clones during passaging. H3K27me3 foci-positive D551-iPSCN1 iPSCs became H3K27me3 foci-negative cells upon passaging, whereas D551-iPSCN6 remained an H3K27me3 foci-positive clone. Scale bar, 20 μm.
(C) Percentage of iPSC clones that underwent the H3K27me3 foci-positive to -negative transition during passaging in (B). A total of ten H3K27me3 foci-positive Detroit 551-derived iPSC clones were picked and expanded to trace the change of H3K27me3 status.
(D) FISH for XIST RNA in iPSCs at passage 10 to determine the X chromosome status. Scale bar, 20 μm.
(E) Representative images of H3K27me3 and OCT4 staining in 6TG-iPSCs at passage 10 and differentiated cells. 6TG-iPSC22 is a class II iPSC and displays H3K27me3 foci before and after differentiation. 6TG-iPSC26 is a class I iPSC and shows formation of H3K27me3 foci only after differentiation. 6TG-iPSC25 is a class III iPSC, and no H3K37me3 foci exist before or after differentiation. Arrow indicates H3K27me3 foci. Scale bar, 20 μm.
(F) Representative images of XIST and ATRX FISH in 6TG-iPSCs at passage 10 and differentiated cells. 6TG-iPSC22 is a class II iPSC and displays one XIST and one ATRX focus before and after differentiation. 6TG-iPSC26 is a class I iPSC and shows formation of XIST after differentiation. Two ATRX foci become one after differentiation. 6TG-iPSC25 is a class III iPSC, and no XIST foci exist before or after differentiation. Scale bar, 20 μm.