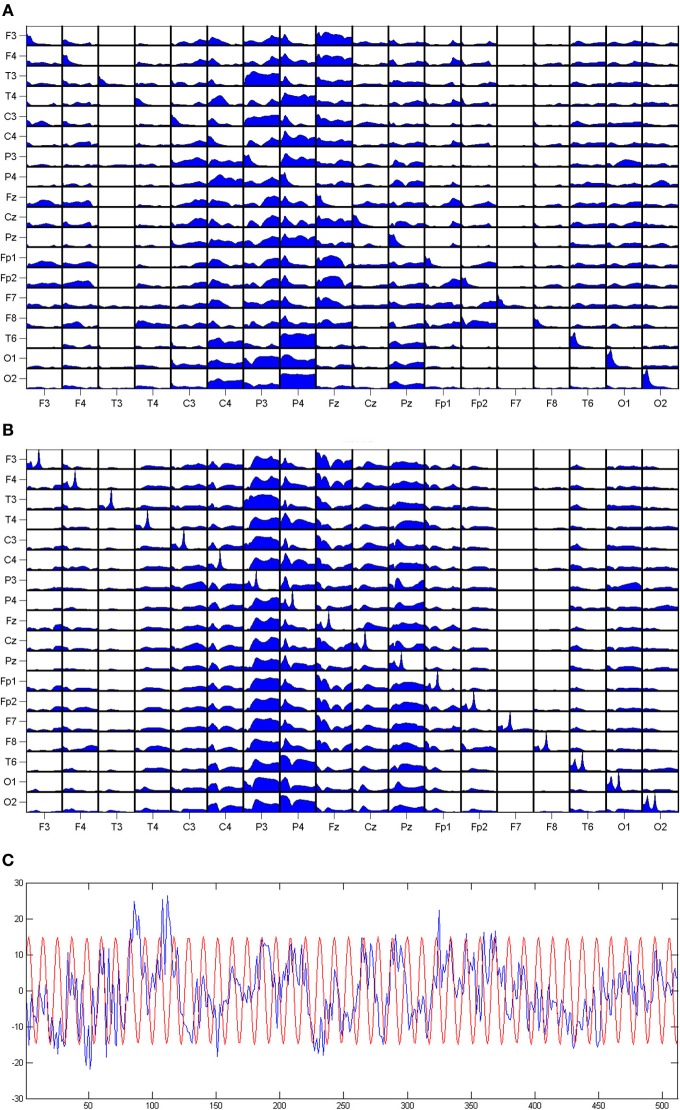
Figure 1.
The DTFs (as functions of frequency) estimated for a set of EEG signals. (A) The results for original dataset, (B) same data with 20 Hz sinusoid added with constant phase to each channel. On the diagonals of the panels power spectra are shown. The propagation from the channel marked below the pictures to the channel marked at the left. At the (C) EEG from one channel with superimposed sinusoid.

