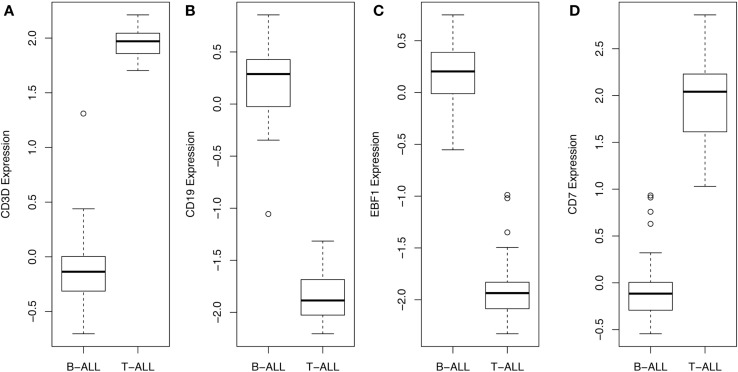
Figure 2.
Gene expression values, across all samples, for top scoring hits. The average and range of values of the top four genes are presented in this box and whisker plot, demonstrating that CD3D and CD7 for T-ALL and CD19 and EBF1 for BCP-ALL (B-ALL) can be used to readily distinguish and verify the original pathological classification of these disease samples.

