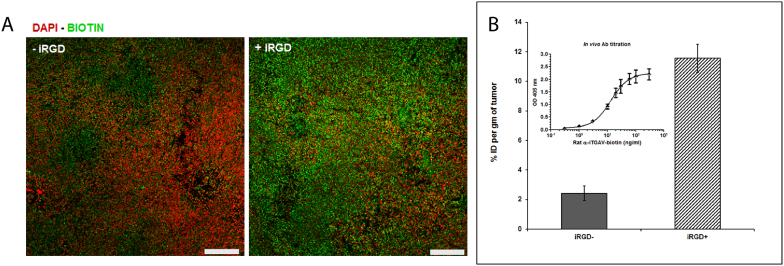
Figure 2. Effect of iRGD on antibody accumulation in tumor tissue.
(A) Fluorescence microscopy images of biotin-labeled rat anti-mouse αv with and without prior injection of the tumor penetrating peptide, iRGD. Images representative of at least five sections from each tumor (n = 3 mice per group) are shown. Scale bars = 100 μm. (B) Percentage of injected dose of the antibody per gram tumor (%ID/g) measured by sandwich ELISA. The inset shows the ELISA standard curve.

