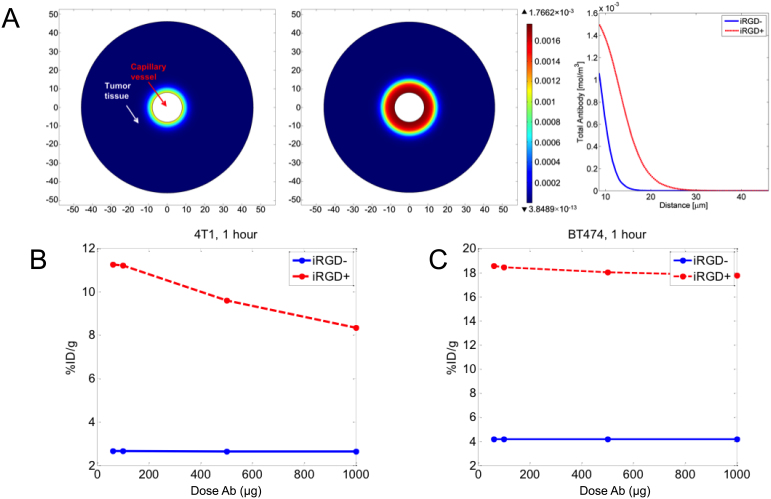
Figure 4.
(A) Tumor total antibody concentration profile after 1 h circulation for BT474 illustrating how the antibody penetrates deeper into the tumor when iRGD is present. (B) Plot of simulation %ID/g vs Antibody (Ab) dose after 1 h circulation with and without iRGD for the 4T1 tumor model and (C) for BT474 tumor model.

